Effective Statistical Communication

Statistics are important tools for describing reality. However, even when the figures themselves are accurate, imprecise wording can still lead to different interpretations or even mislead readers. The following section will introduce several common pitfalls in statistical expression, helping you better grasp the core of information when presenting or reading statistics.
The “multiples” trap — three times or an increase by three times?
When using “multiples” to describe increases, one must be careful with the wording used.
Assume the base figure is 10:
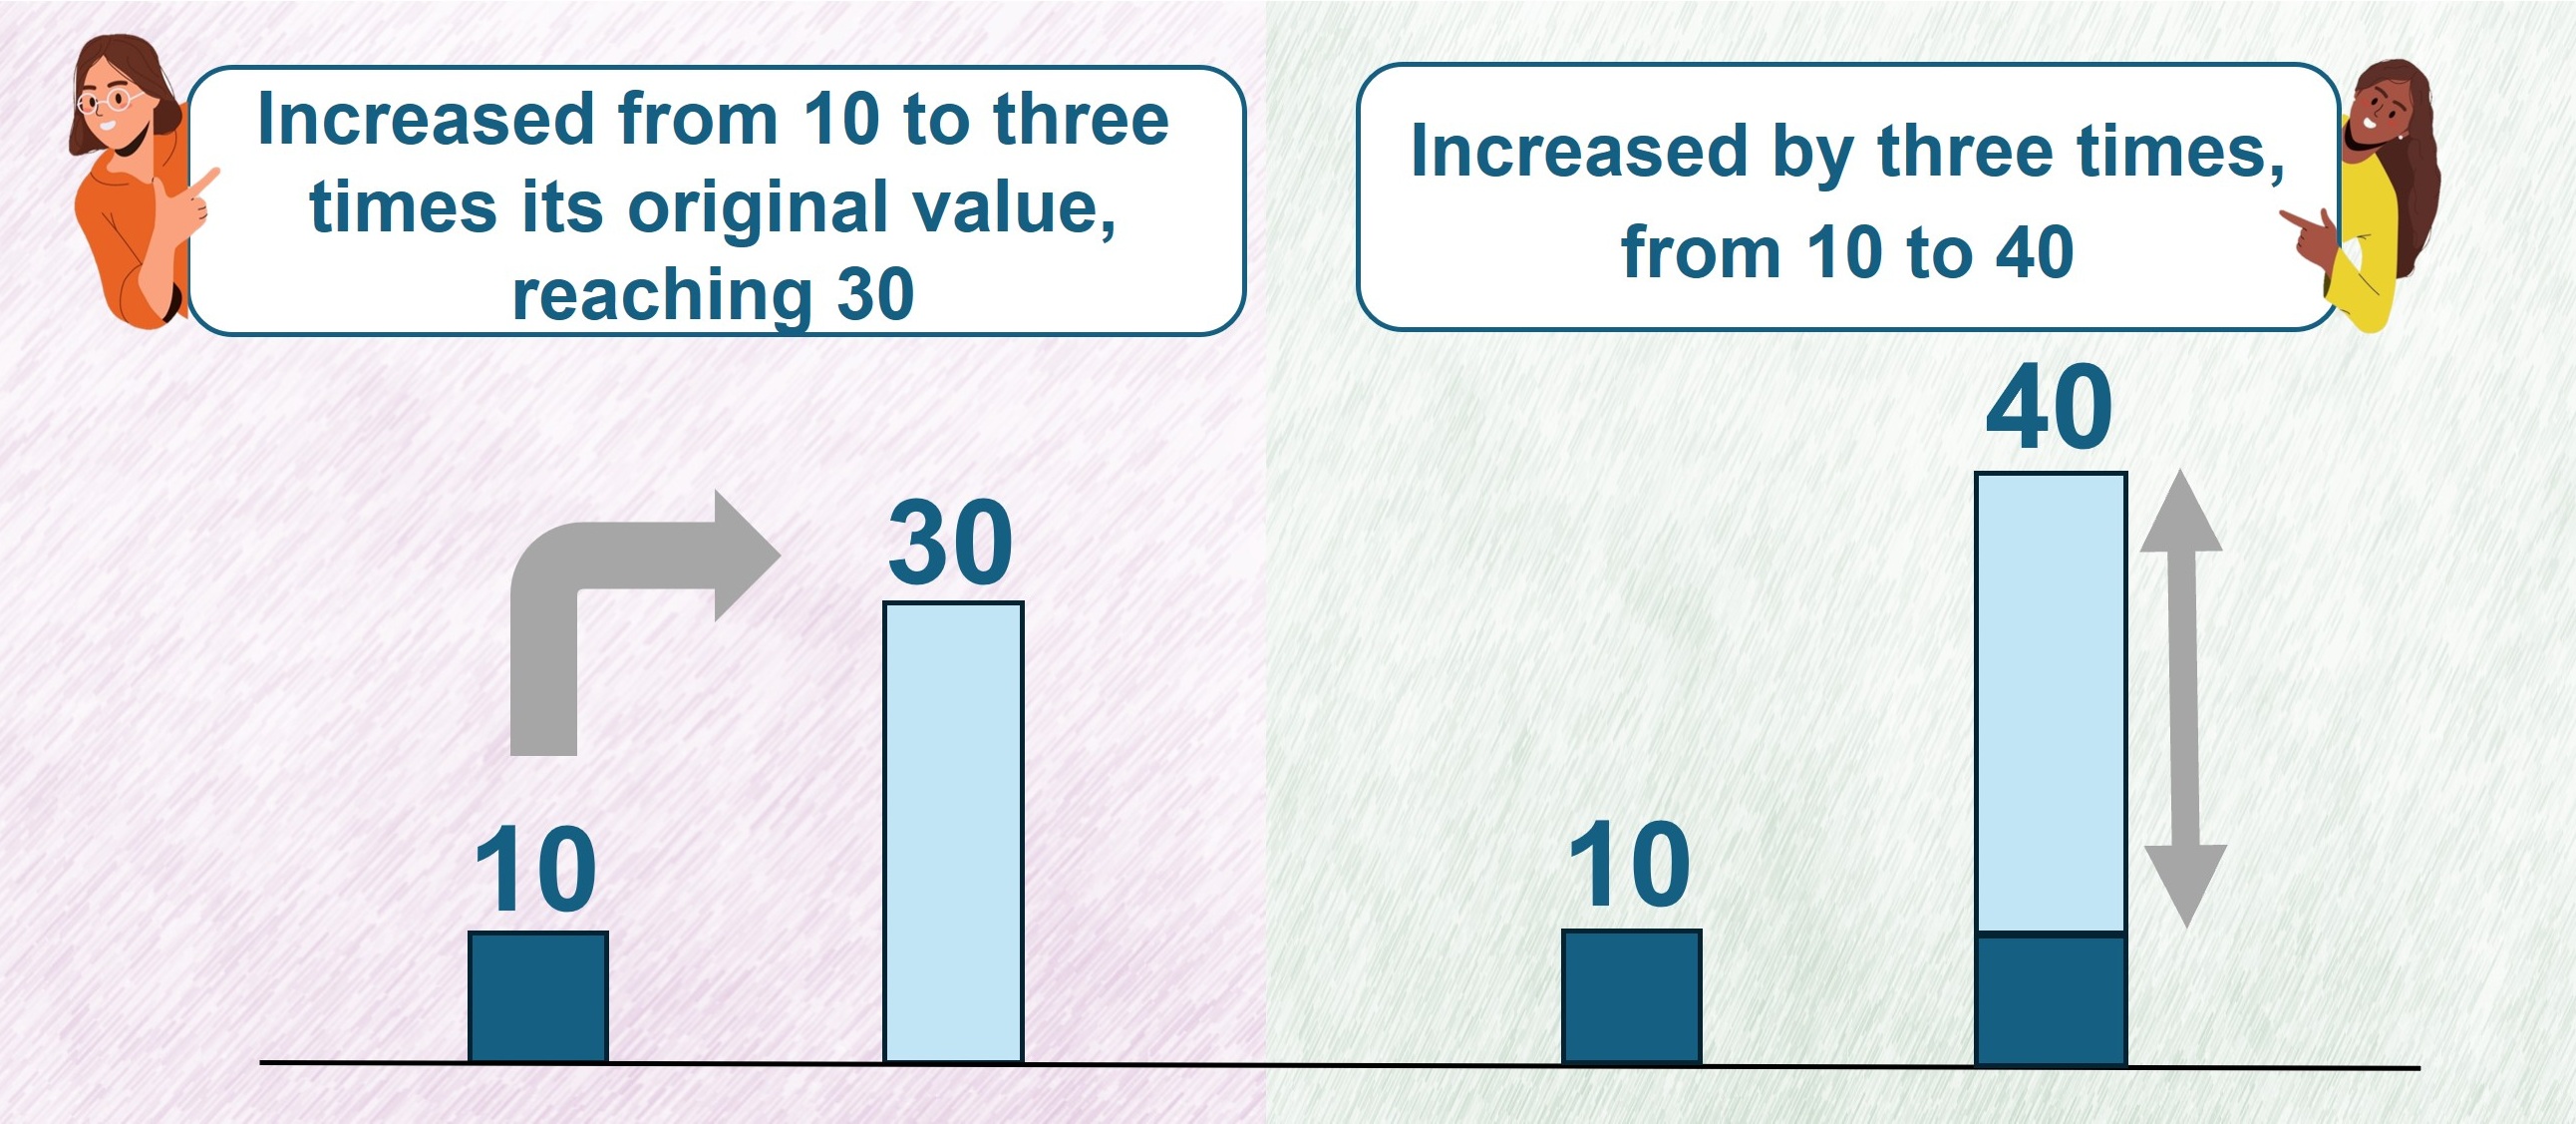
- Increased to three times: represents a change from 10 to 30.
- Increased by three times: represents an additional three times the original base figure; the result should be 10 + 3 × 10 = 40.
To avoid confusion, one can simultaneously list the “multiples” and the figures before and after the change, such as “increased from 10 to three times its original value, reaching 30” or “increased by three times, from 10 to 40”.
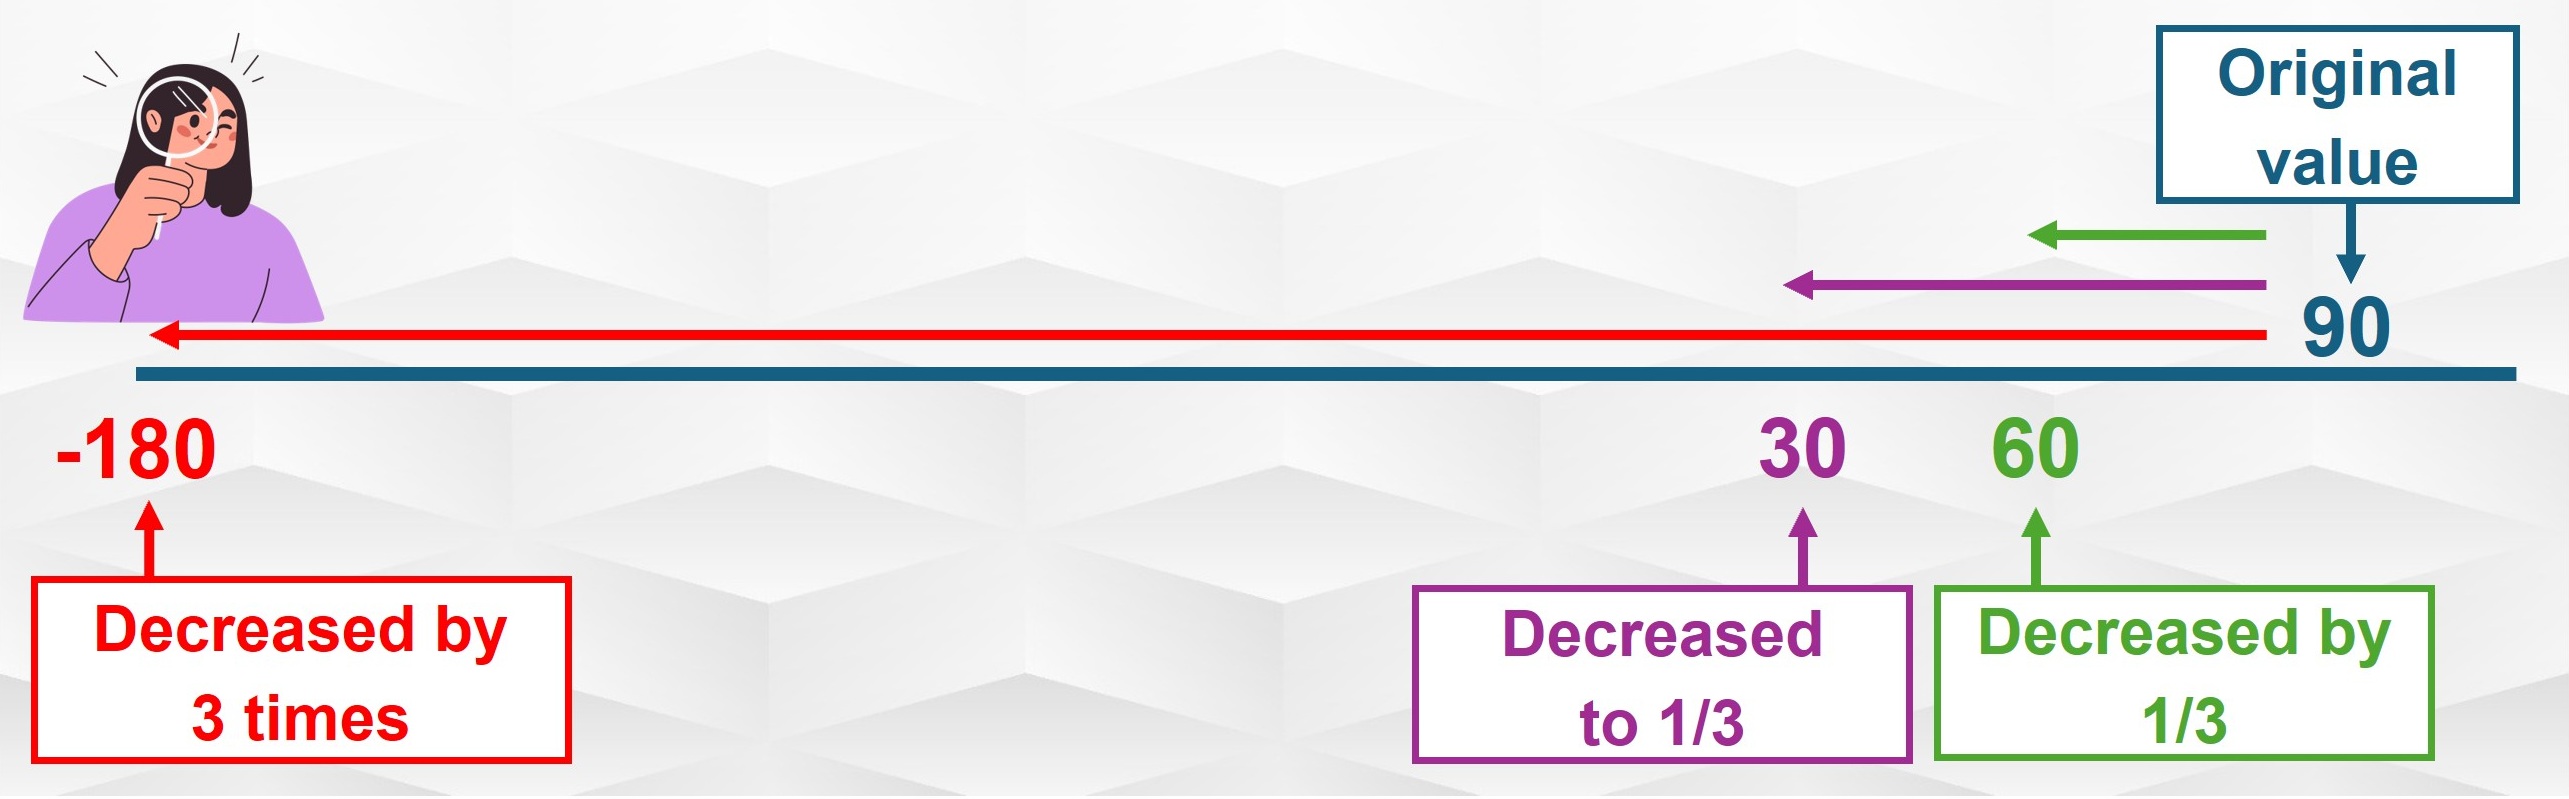
Furthermore, one should avoid using “multiples” to describe decreases, as a decrease more than one time would actually result in a negative value, which is unlikely to be the intended meaning of the description. For example, if a shop had 90 transactions yesterday and the owner claimed that today’s business was very slack, dropping by three times compared to yesterday, the number of transactions today would be 90 – 90 × 3 = –180. This is clearly incorrect. What the owner likely meant was that yesterday’s transactions were three times that of today, i.e. today’s transactions were only one-third of yesterday’s (90 × 1/3 = 30).
Therefore, when describing decreases, it is recommended to use “fractions” or “percentages” for greater clarity. For example,
- Drop from 90 to 30: “decreased to one‑third” or “decreased by about 67%” (90 × 1/3 = 30).
- Drop from 90 to 60: “decreased by one-third” or “decreased by about 33%” (90 – 90 × 1/3 = 60).
Percentage or percentage points?
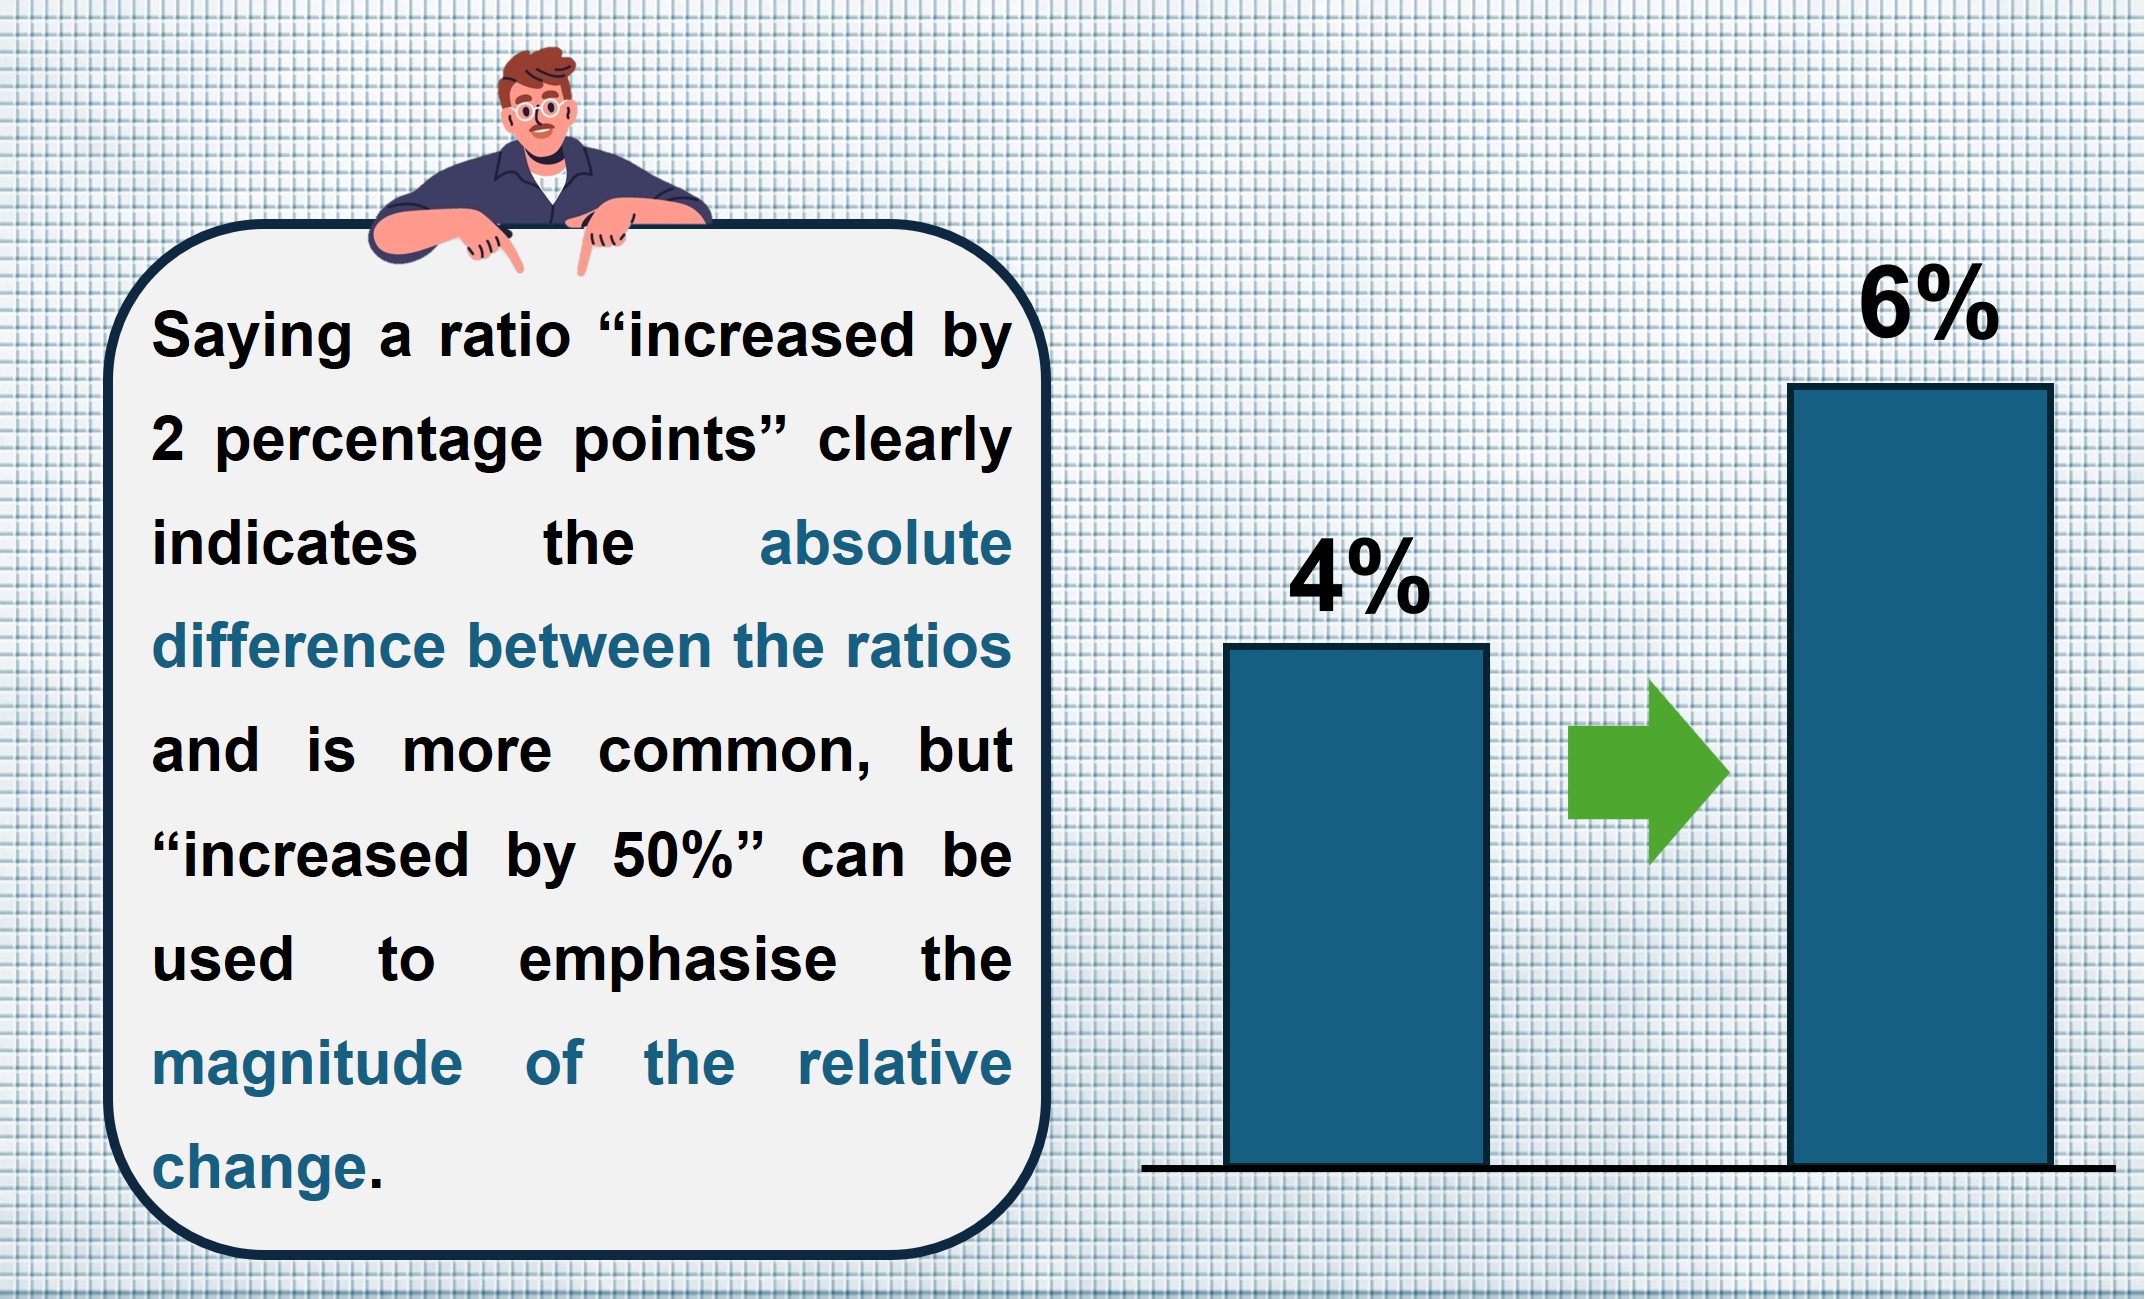
“Ratio” figures, e.g. “birth rates”, are commonly seen. When describing the difference between ratios, “percentage points” and “percentage” are two common expressions. Taking the rise of birth rate from 4% to 6% as an example:
- Percentage points: the difference is 2 percentage points.
- Percentage: the relative increase is 50%.
Both expressions are correct but with different foci: “percentage points” clearly expresses the absolute difference between the ratios, while “percentage” emphasises the magnitude of the relative change, though it can sometimes be less intuitive to grasp at a glance.
Avoiding traps of statistical expressions: reporting only actual figures or proportions is often inadequate
Simply presenting “actual figures” or “relative proportions” is often insufficient to reflect the full picture.
Let us look at the following example:
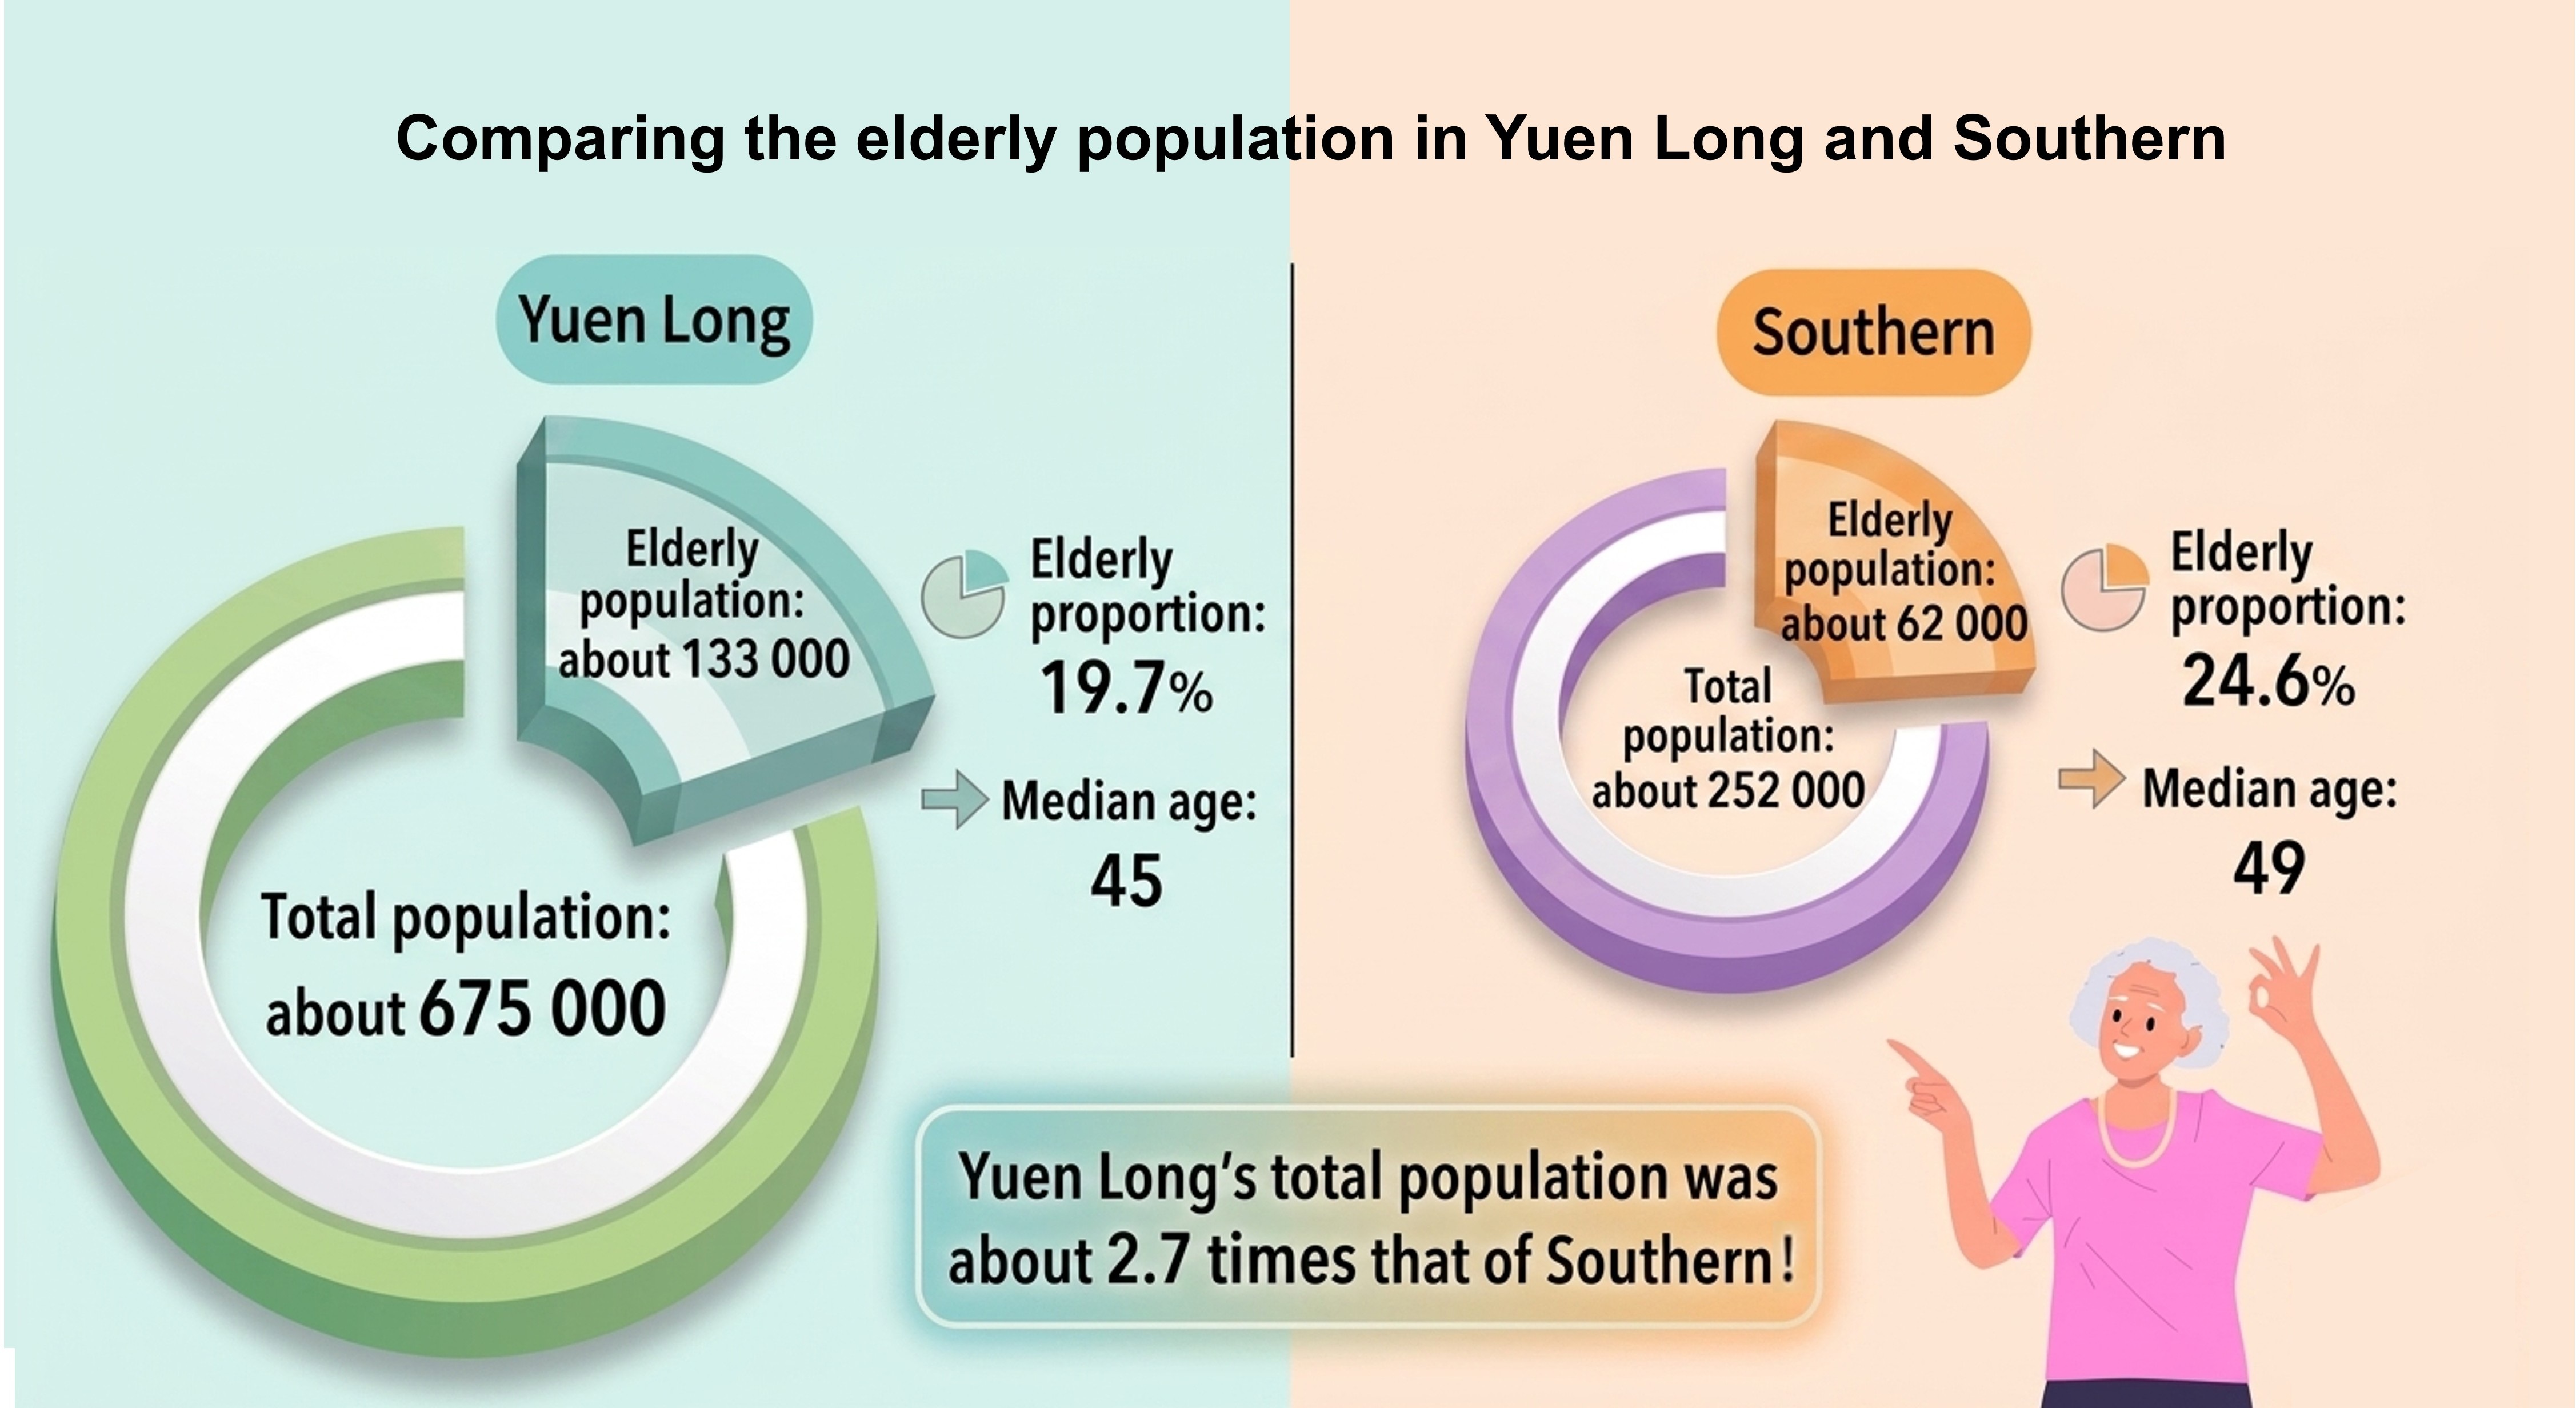
“According to 2025 statistics, the elderly population in Yuen Long was about 133 000, compared to about 62 000 in Southern.”
If one only compares these two figures, population ageing in Yuen Long seems more notable.
However, Yuen Long’s total population was 2.7 times that of Southern. Its elderly proportion was only 19.7%, actually lower than the 24.6% in Southern. Besides, the median age in Yuen Long was 45, which was also younger than Southern’s 49. This example illustrates how comparing actual figures without considering the corresponding base numbers can sometimes distort comparisons and even lead to false conclusions.
Conversely, when the base number is small, relying solely on “proportions” can also cause misunderstanding. For example, in a test of a new medicine, a “90% success rate” sounds very definitive. However, if the test was only conducted on 10 persons, the results will become far less convincing. Reporting only the proportion while hiding the actual figure may easily lead readers to overestimate the true scale of the test.
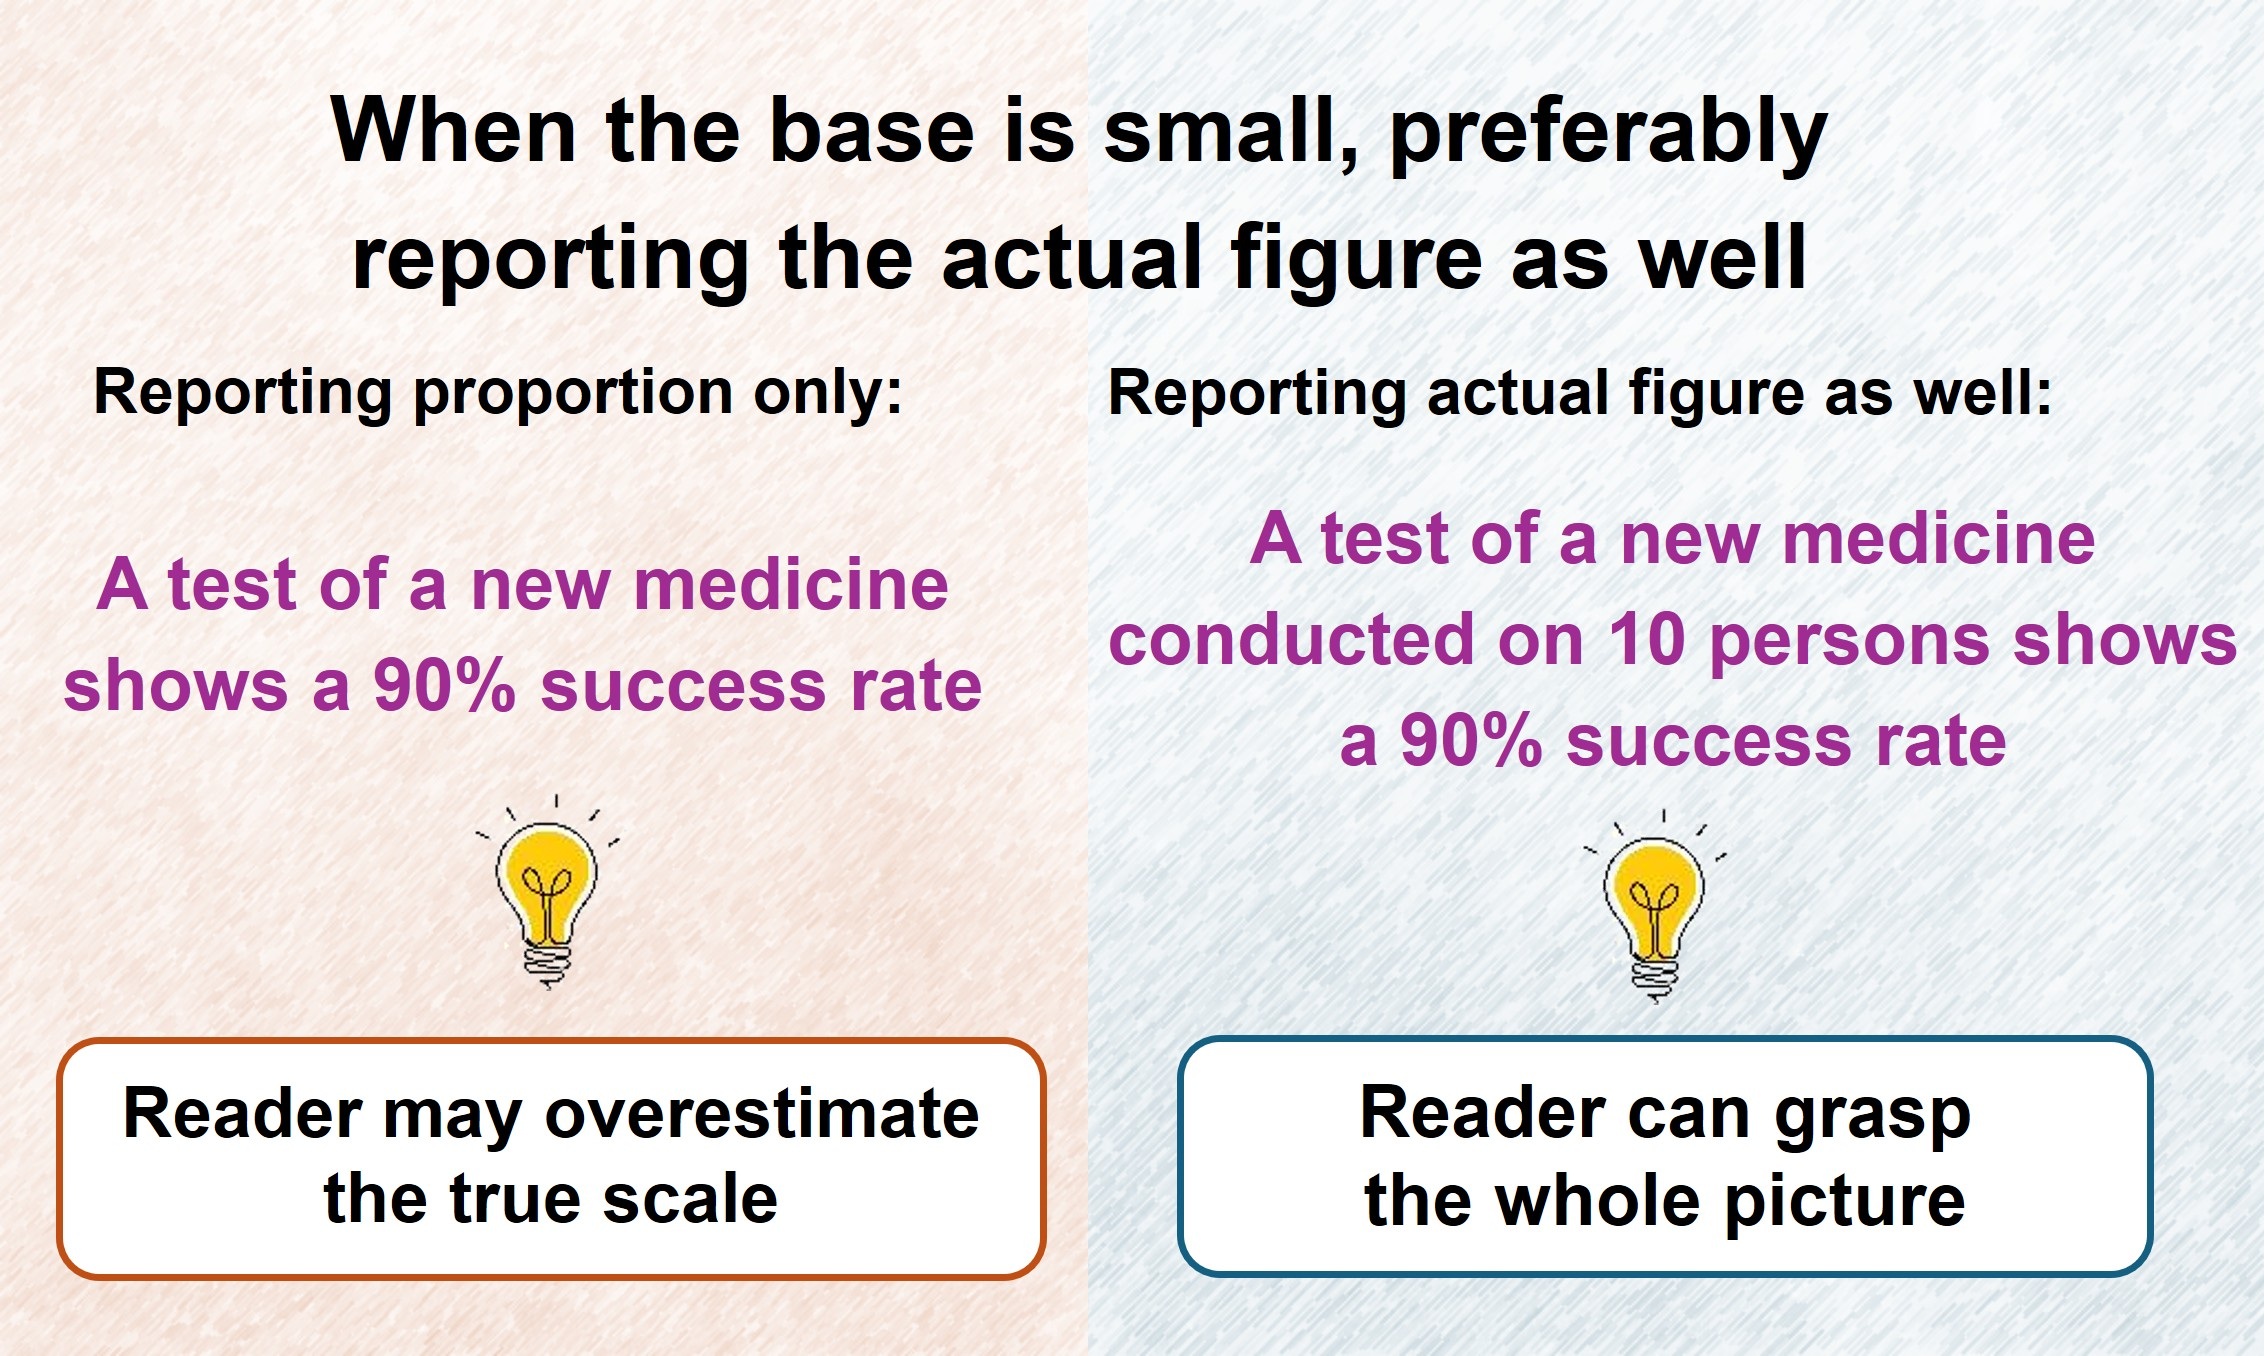
The above examples demonstrate that reporting both “actual figures” and “proportions” can provide a complete picture. This practice reflects the actual scale of the subjects being compared while enables a fair relative comparison, thereby preventing readers from being misled.
Clear language builds trust
Clear statistical expression goes beyond the numbers. It also depends on precise use of language during presentation. Effective statistical communication ensures data are presented with accurate and meaningful comparisons and analysis, allowing statistics to illuminate reality and fostering correct understanding.
NG Yi-cheong, Ian
Statistician
6 May 2026