Are you seeing the whole truth? Let’s explore Simpson's Paradox using Hong Kong's Labour Force Participation Rate as an example

Have you ever come across a situation where different subgroups' numbers are increasing, yet the overall total is decreasing? This may sound counterintuitive, but it illustrates a special statistical phenomenon – Simpson's Paradox. We will use Hong Kong's Labour Force Participation Rate as an example to explain the concept.
Example: Hong Kong's Labour Force Participation Rate (LFPR)
Let's compare the LFPRs of different age groups in Hong Kong for 1994 and 2024. Except for people in the youngest age group (aged 15 to 29), whose participation rate dropped slightly due to increased educational opportunities, all other age groups saw their participation rates rise.
(Note: People under 15 are not counted in the labour force.)
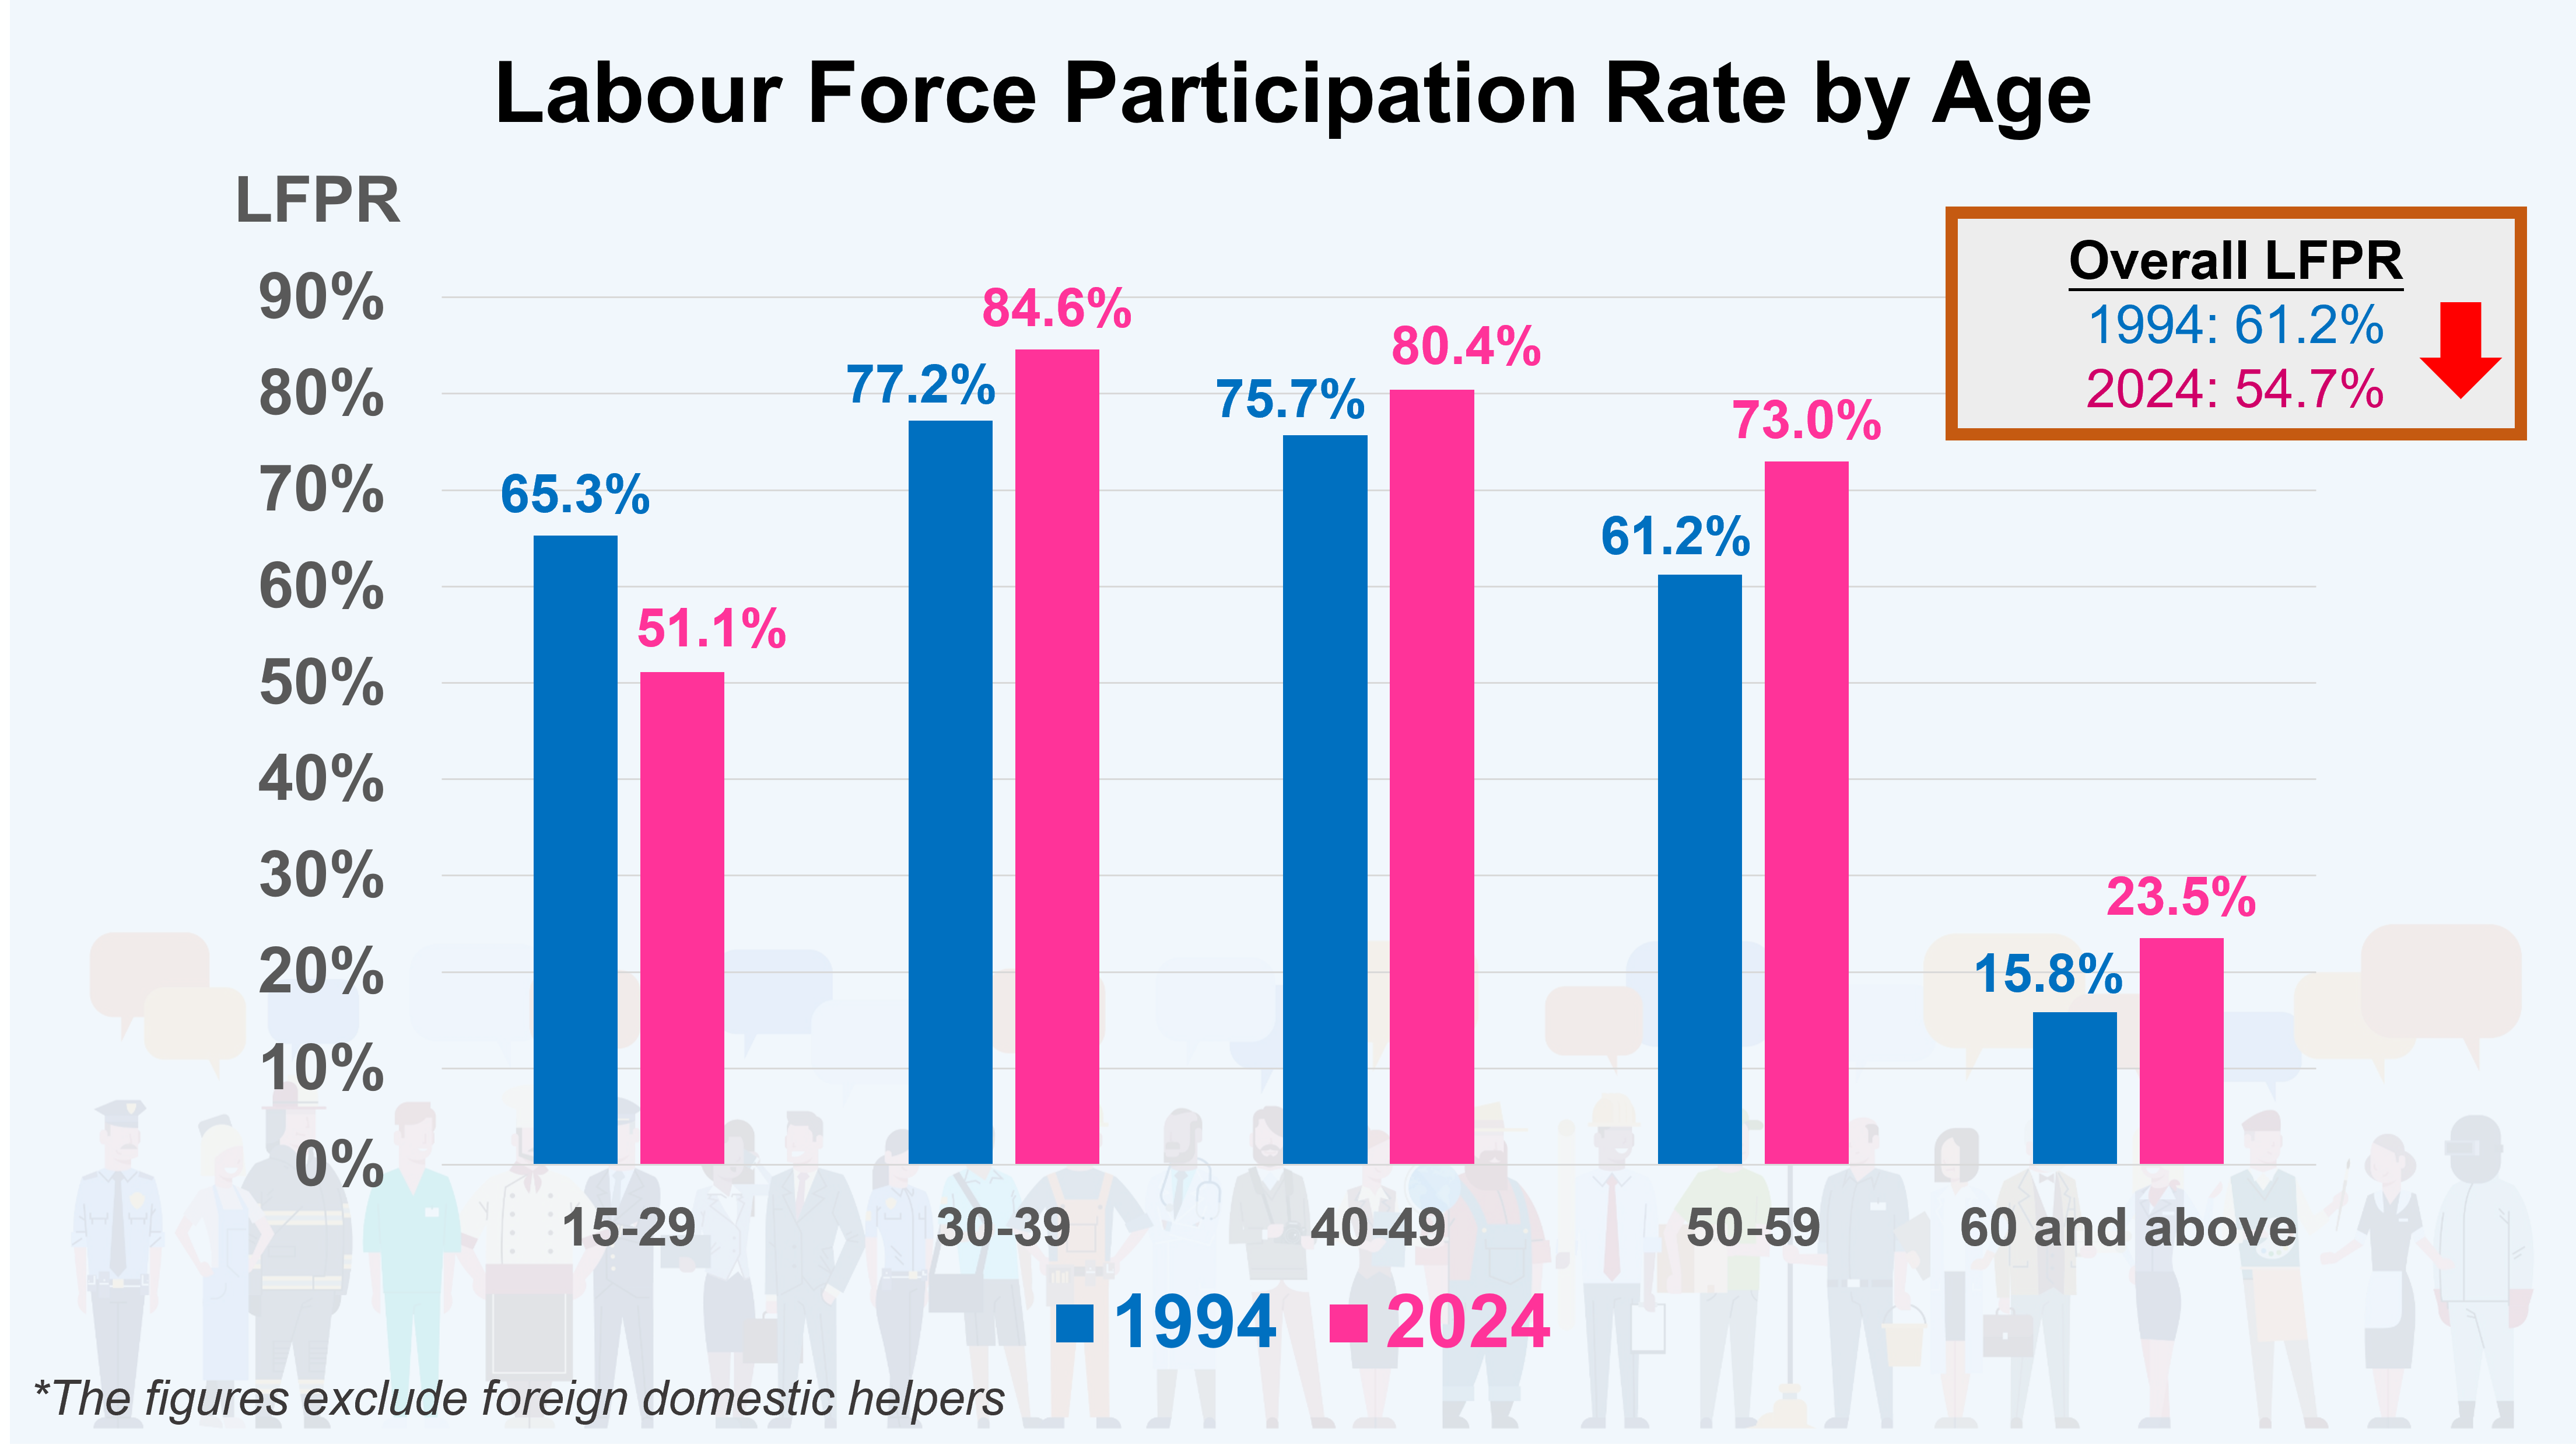
Intuitively, if the LFPRs of most age groups are increasing, the overall LFPR should also increase, shouldn't it? However, the overall LFPR dropped from 61% in 1994 to 55% in 2024. This is a typical example of Simpson's Paradox – the subgroup data shows one trend, but the overall trend moves in the opposite direction.
What is Labour Force Participation Rate (LFPR)?

How does ageing population lead to Simpson's Paradox?
This seemingly unreasonable phenomenon actually stems from a hidden factor not having been considered: the age structure of Hong Kong's population had changed significantly during 1994 to 2024.
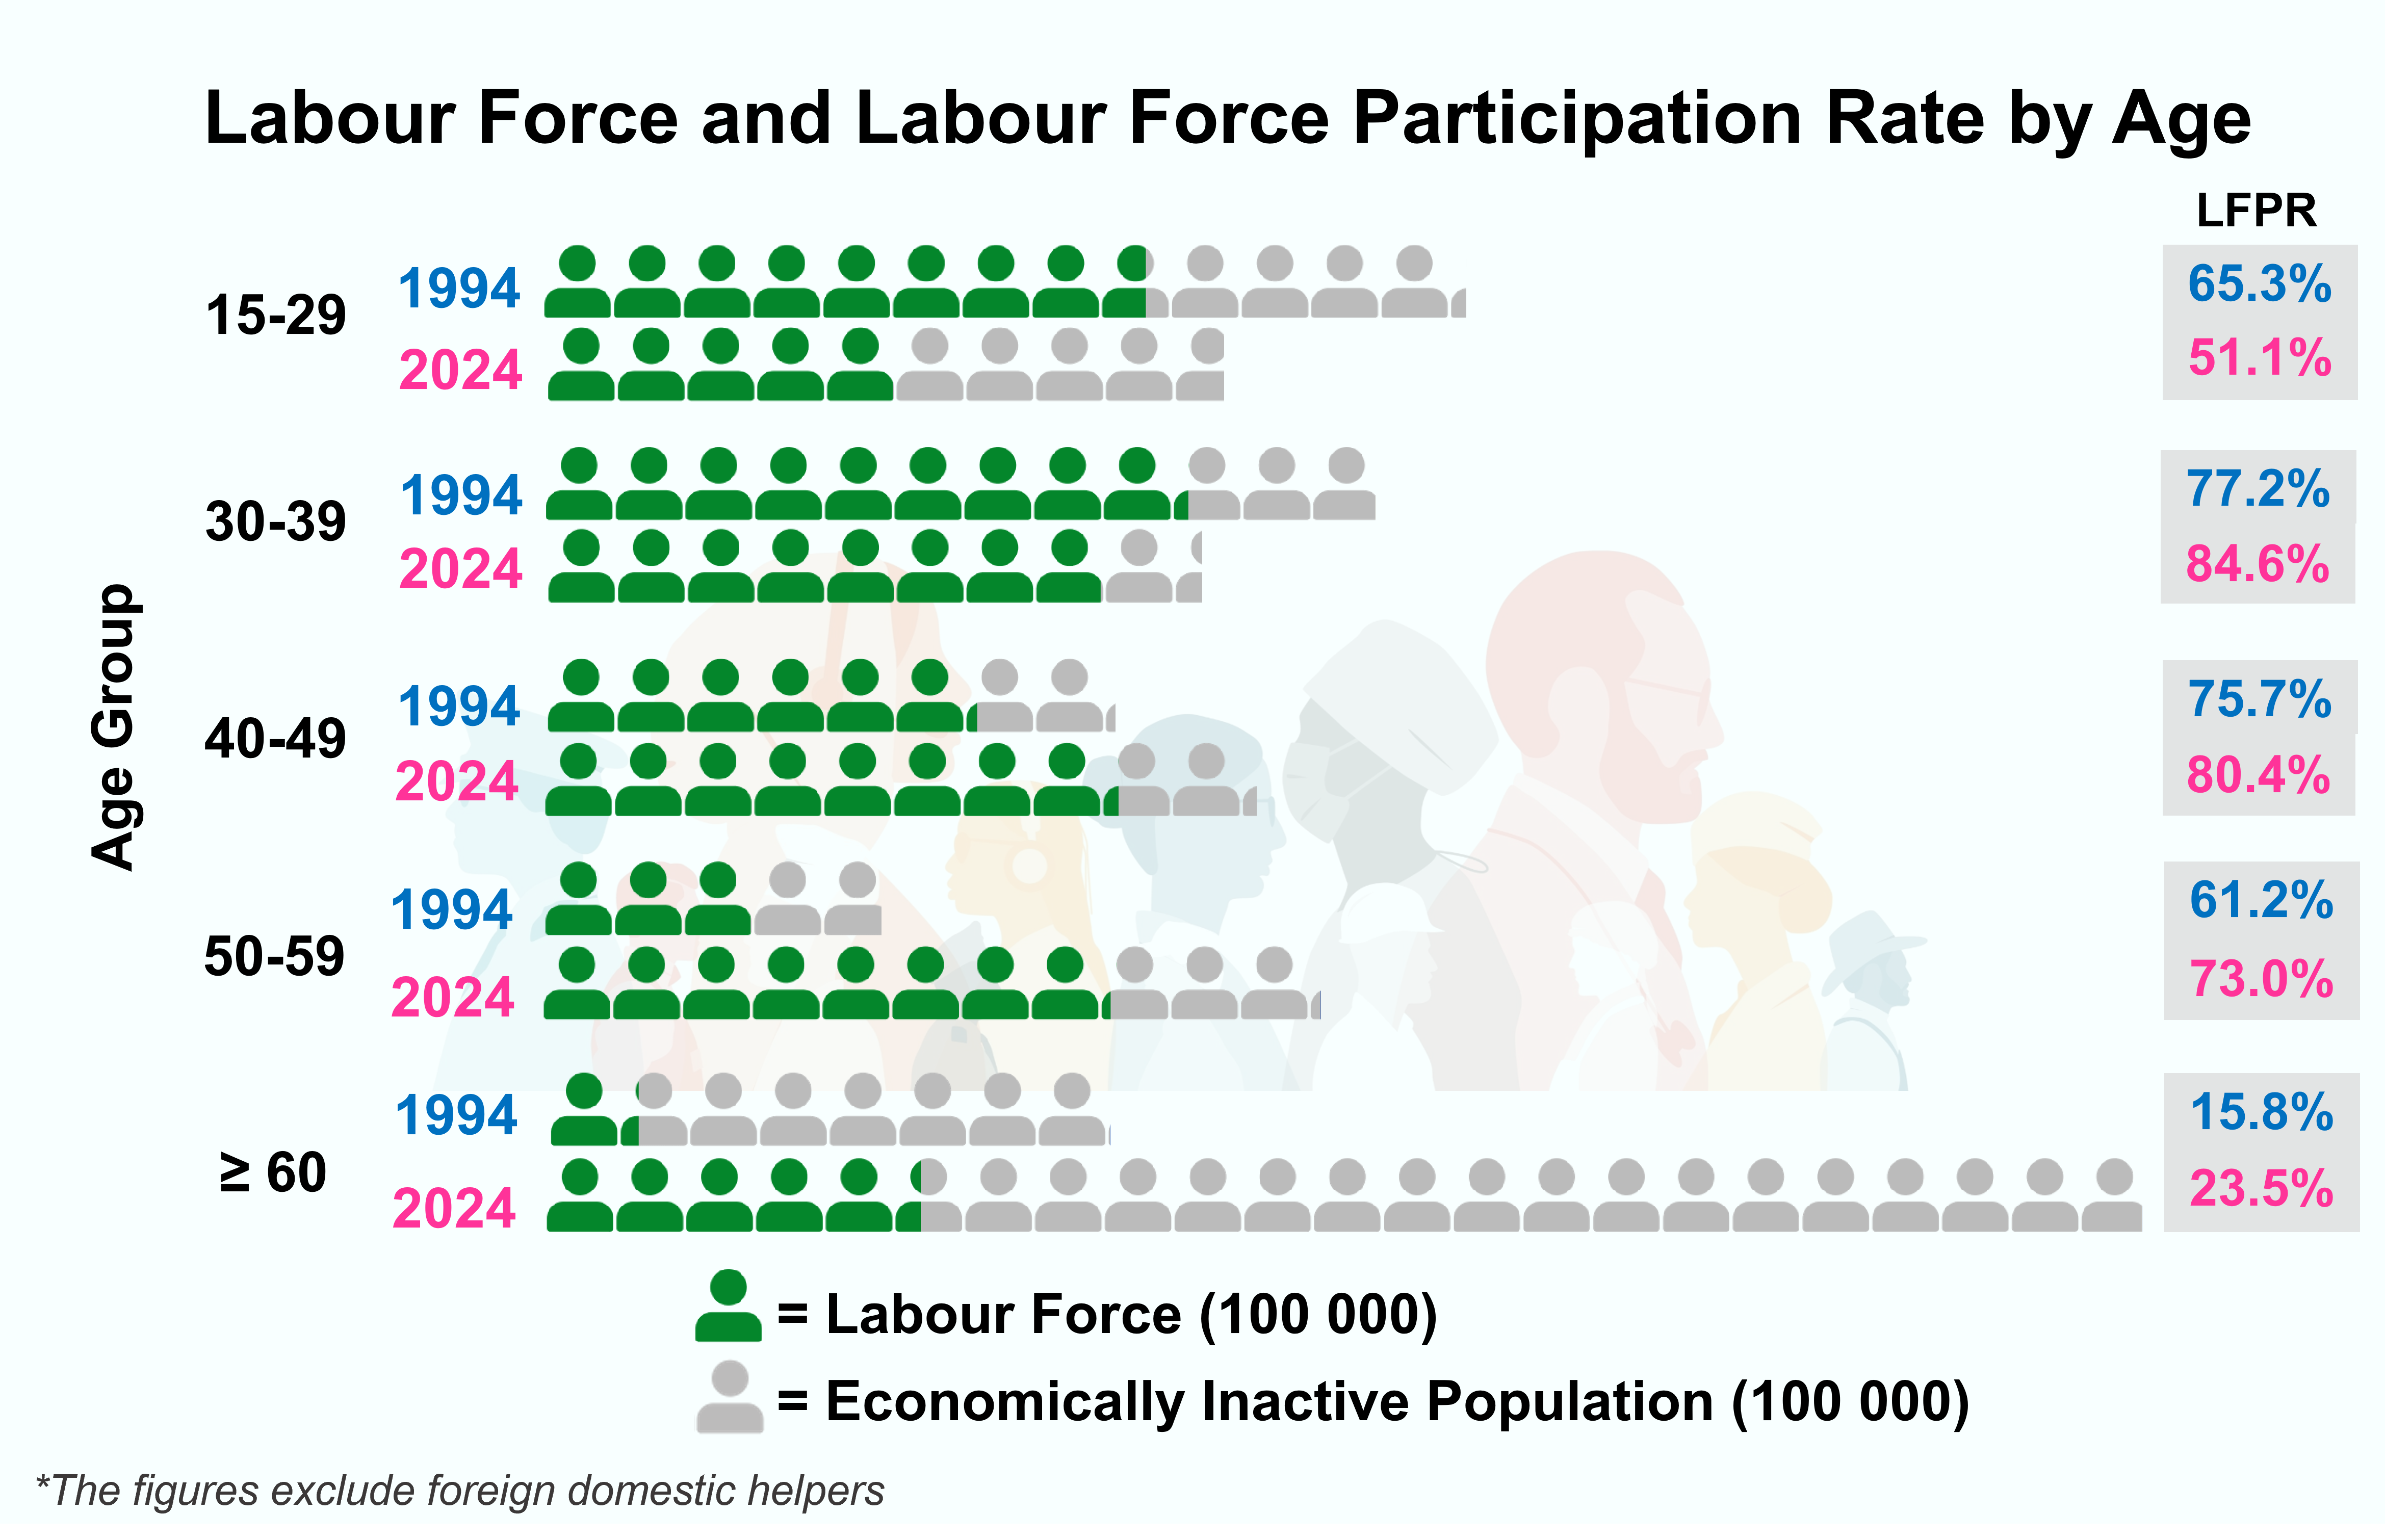
- Sharp increase in share of elderly population: the share of those aged 60 and over among the population aged 15 and over increased significantly from 17% in 1994 to 36% in 2024.
- Low participation rate among the elderly: even though elderly's participation rate has increased, its level remains far lower than those for other age groups, thereby dragging down the overall LFPR.
The above example illustrates the gist of Simpson's Paradox: when relative shares of individual subgroups change remarkably, and their numbers (like LFPR in the above example) are at very different levels, the subgroup trends and overall trend may not be synchronised, or even go in conflicting directions.
Conclusion: take a closer look at the data
Simpson's Paradox reminds us that interpreting data requires more than merely observing overall trends. We must drill down into the data for individual subgroups and also pay close attention to the changes in their relative shares to uncover the true story behind the numbers.
WONG Hoi-tung, Estela
Research Manager
3 September 2025