A Decade of Change: The Evolution of Consumer Prices in Hong Kong

Do you know how the prices of goods and services we commonly purchase have changed over the past decade? Which categories of consumer goods and services have experienced the largest price increases? Have prices risen in all categories? Let's find out together.
Changes in overall consumer prices between 2014 and 2024
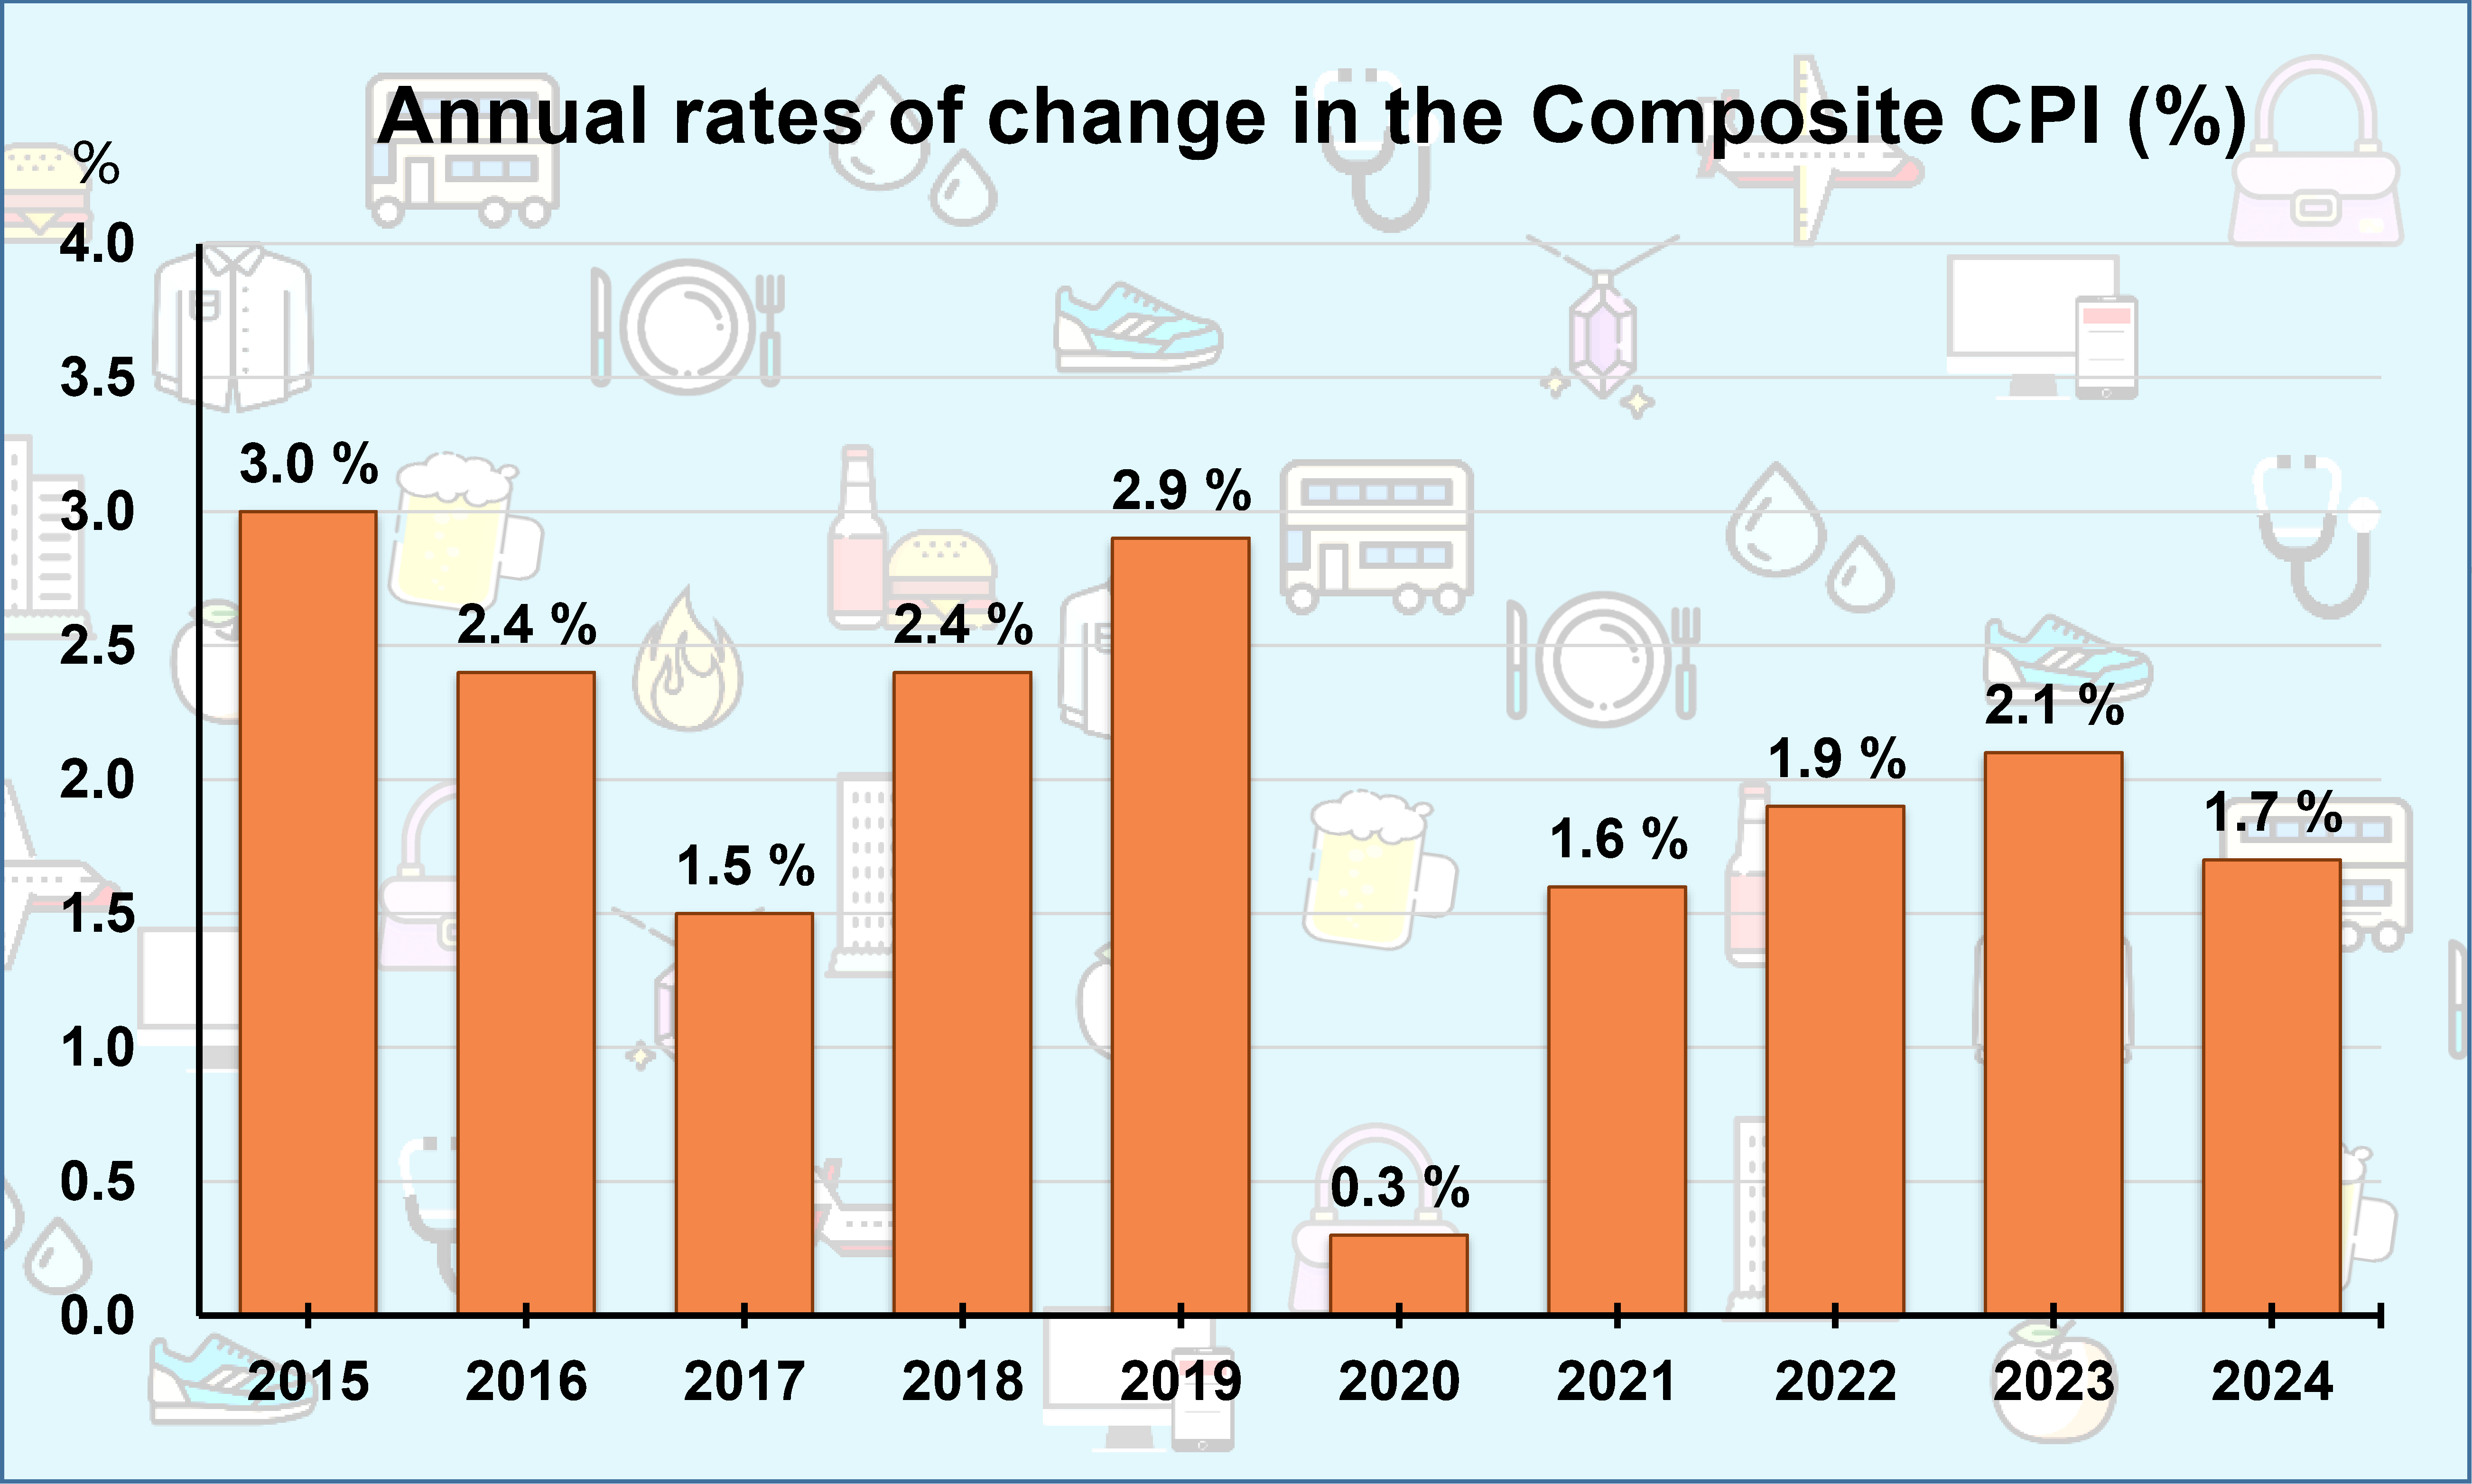
In general, we use the Composite Consumer Price Index (CPI) to measure overall consumer prices, which is compiled based on the average spending patterns of approximately 90% of households in Hong Kong. The overall consumer prices increased by 21.5% between 2014 and 2024, representing an average annual increase of 2.0%. In the past decade, the largest annual increase was in 2015 (3.0%), while the smallest was in 2020 (0.3%).
Which categories of consumer goods and services have experienced the largest price increases?
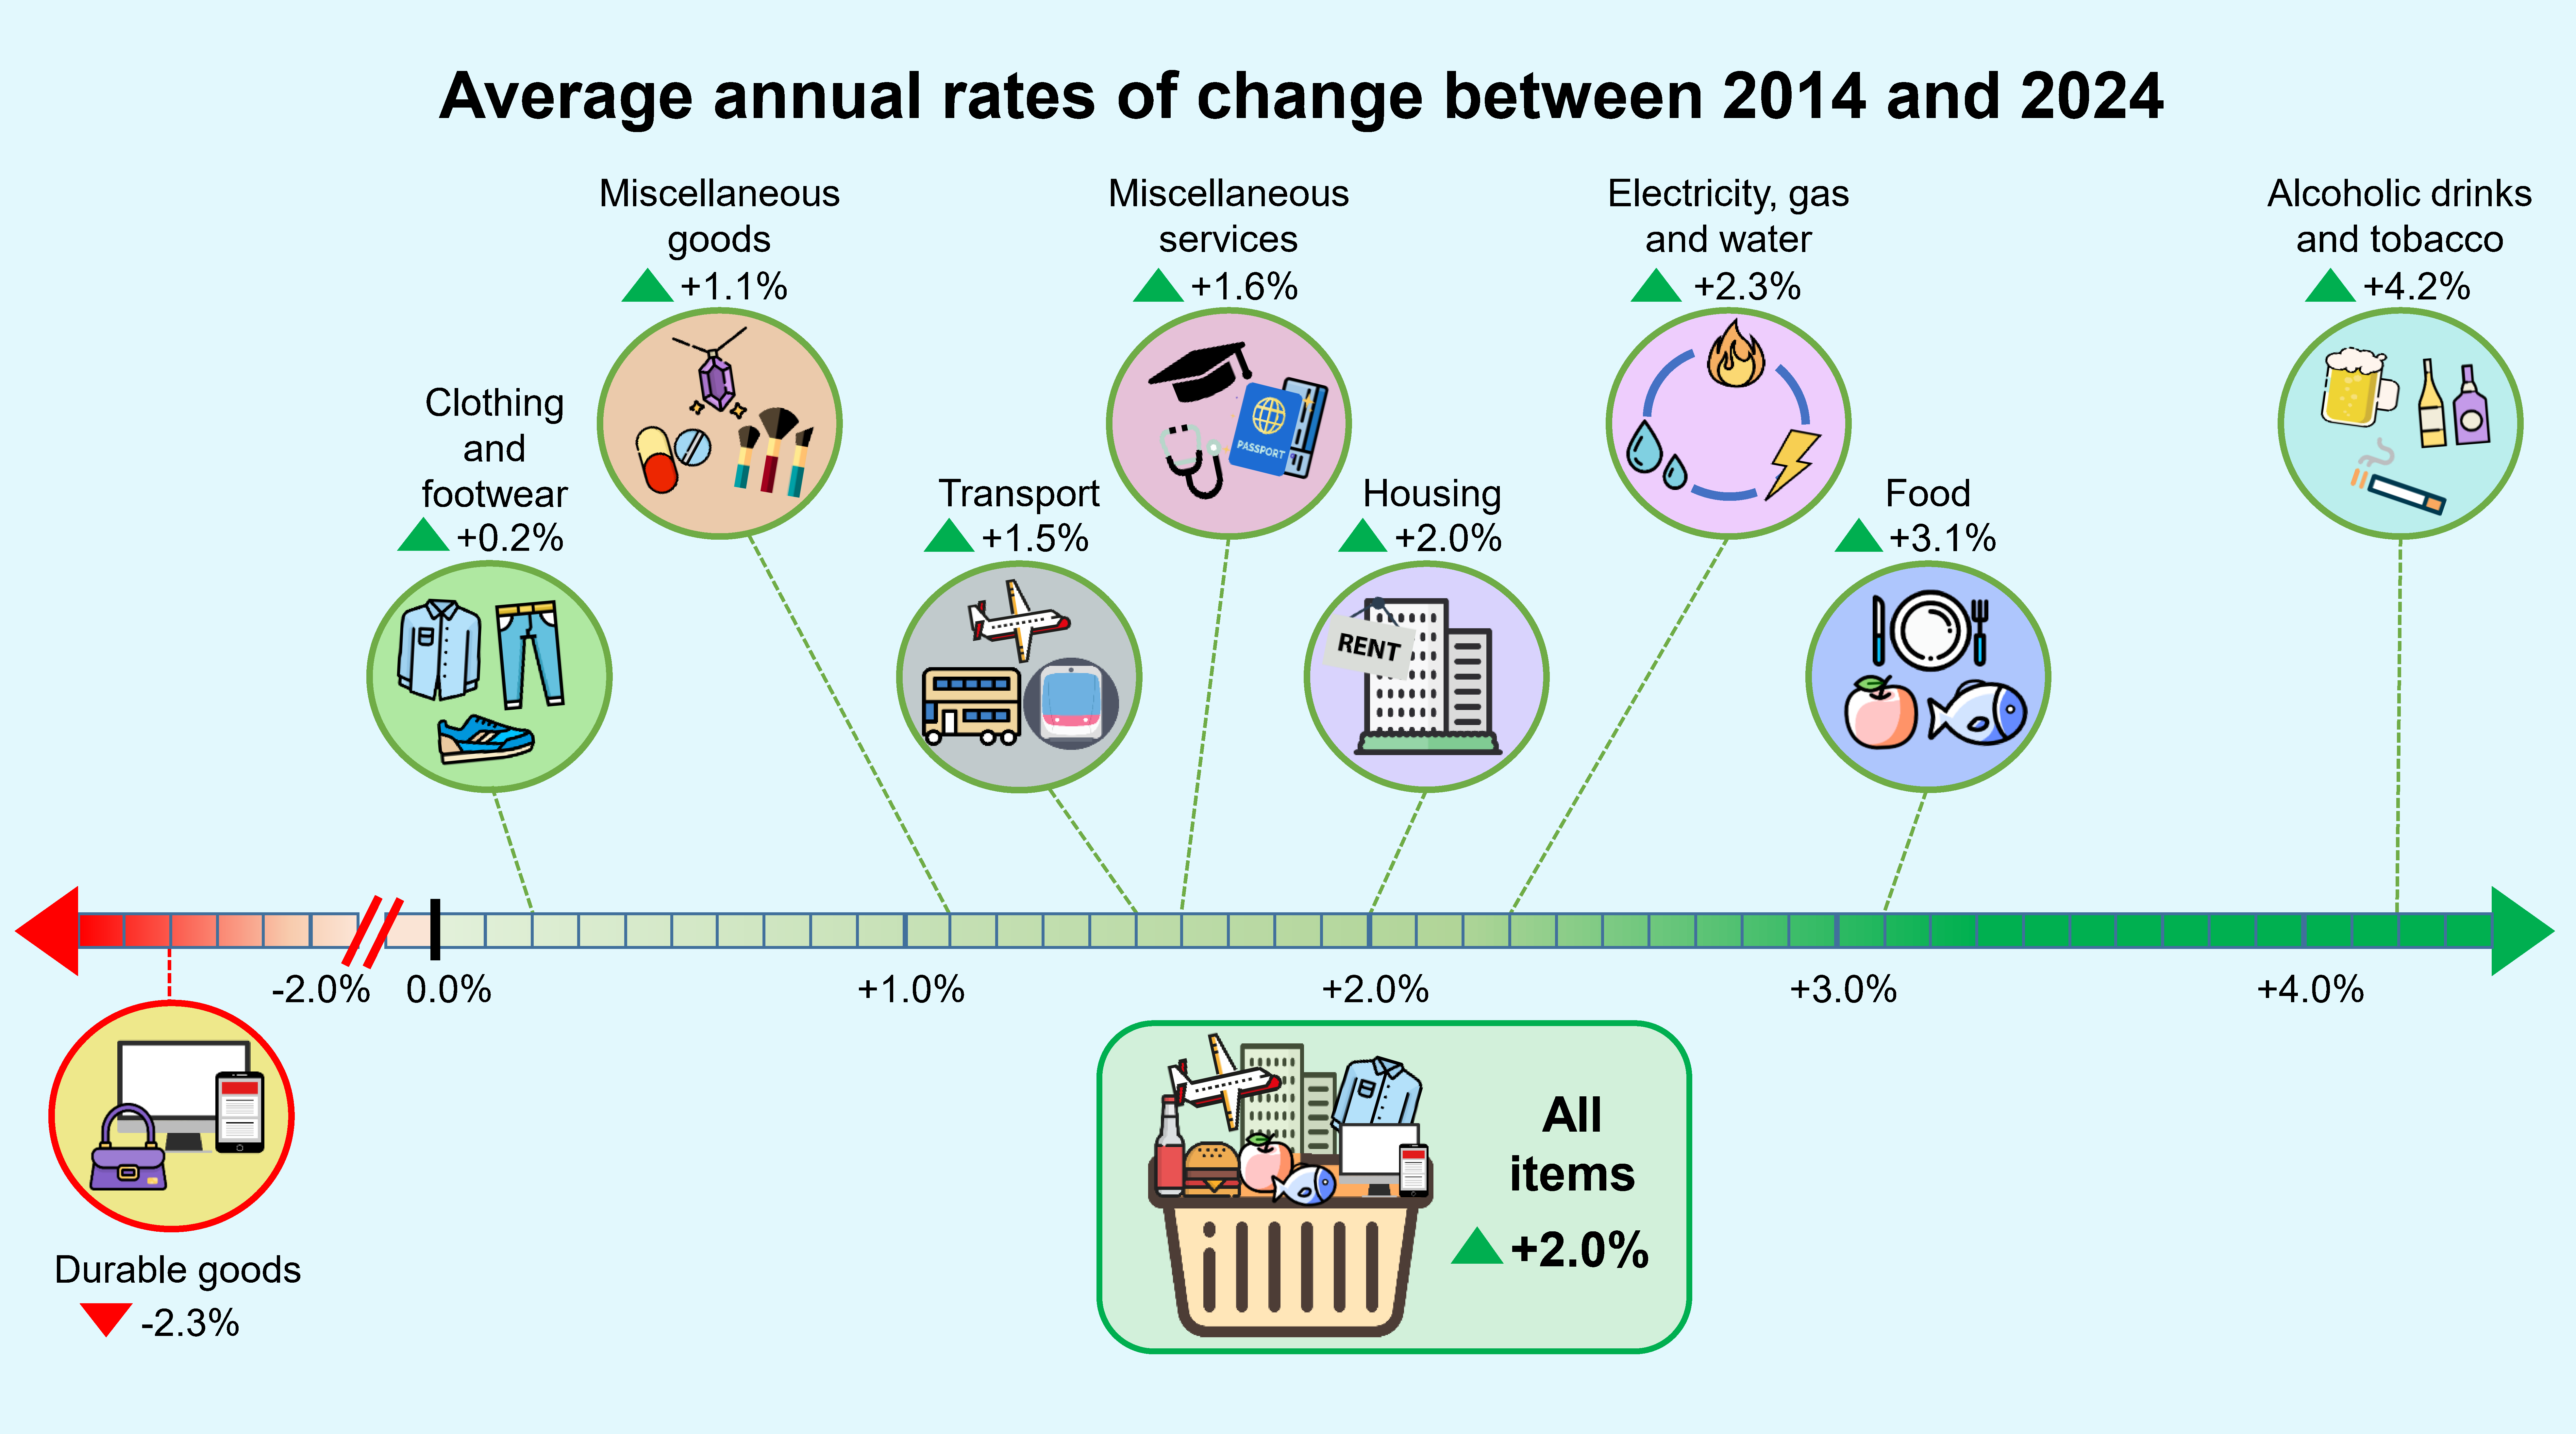
- Between 2014 and 2024, the average annual increases in the prices of "Alcoholic drinks and tobacco", "Food" and "Electricity, gas and water" outpaced the corresponding increase in overall consumer prices.
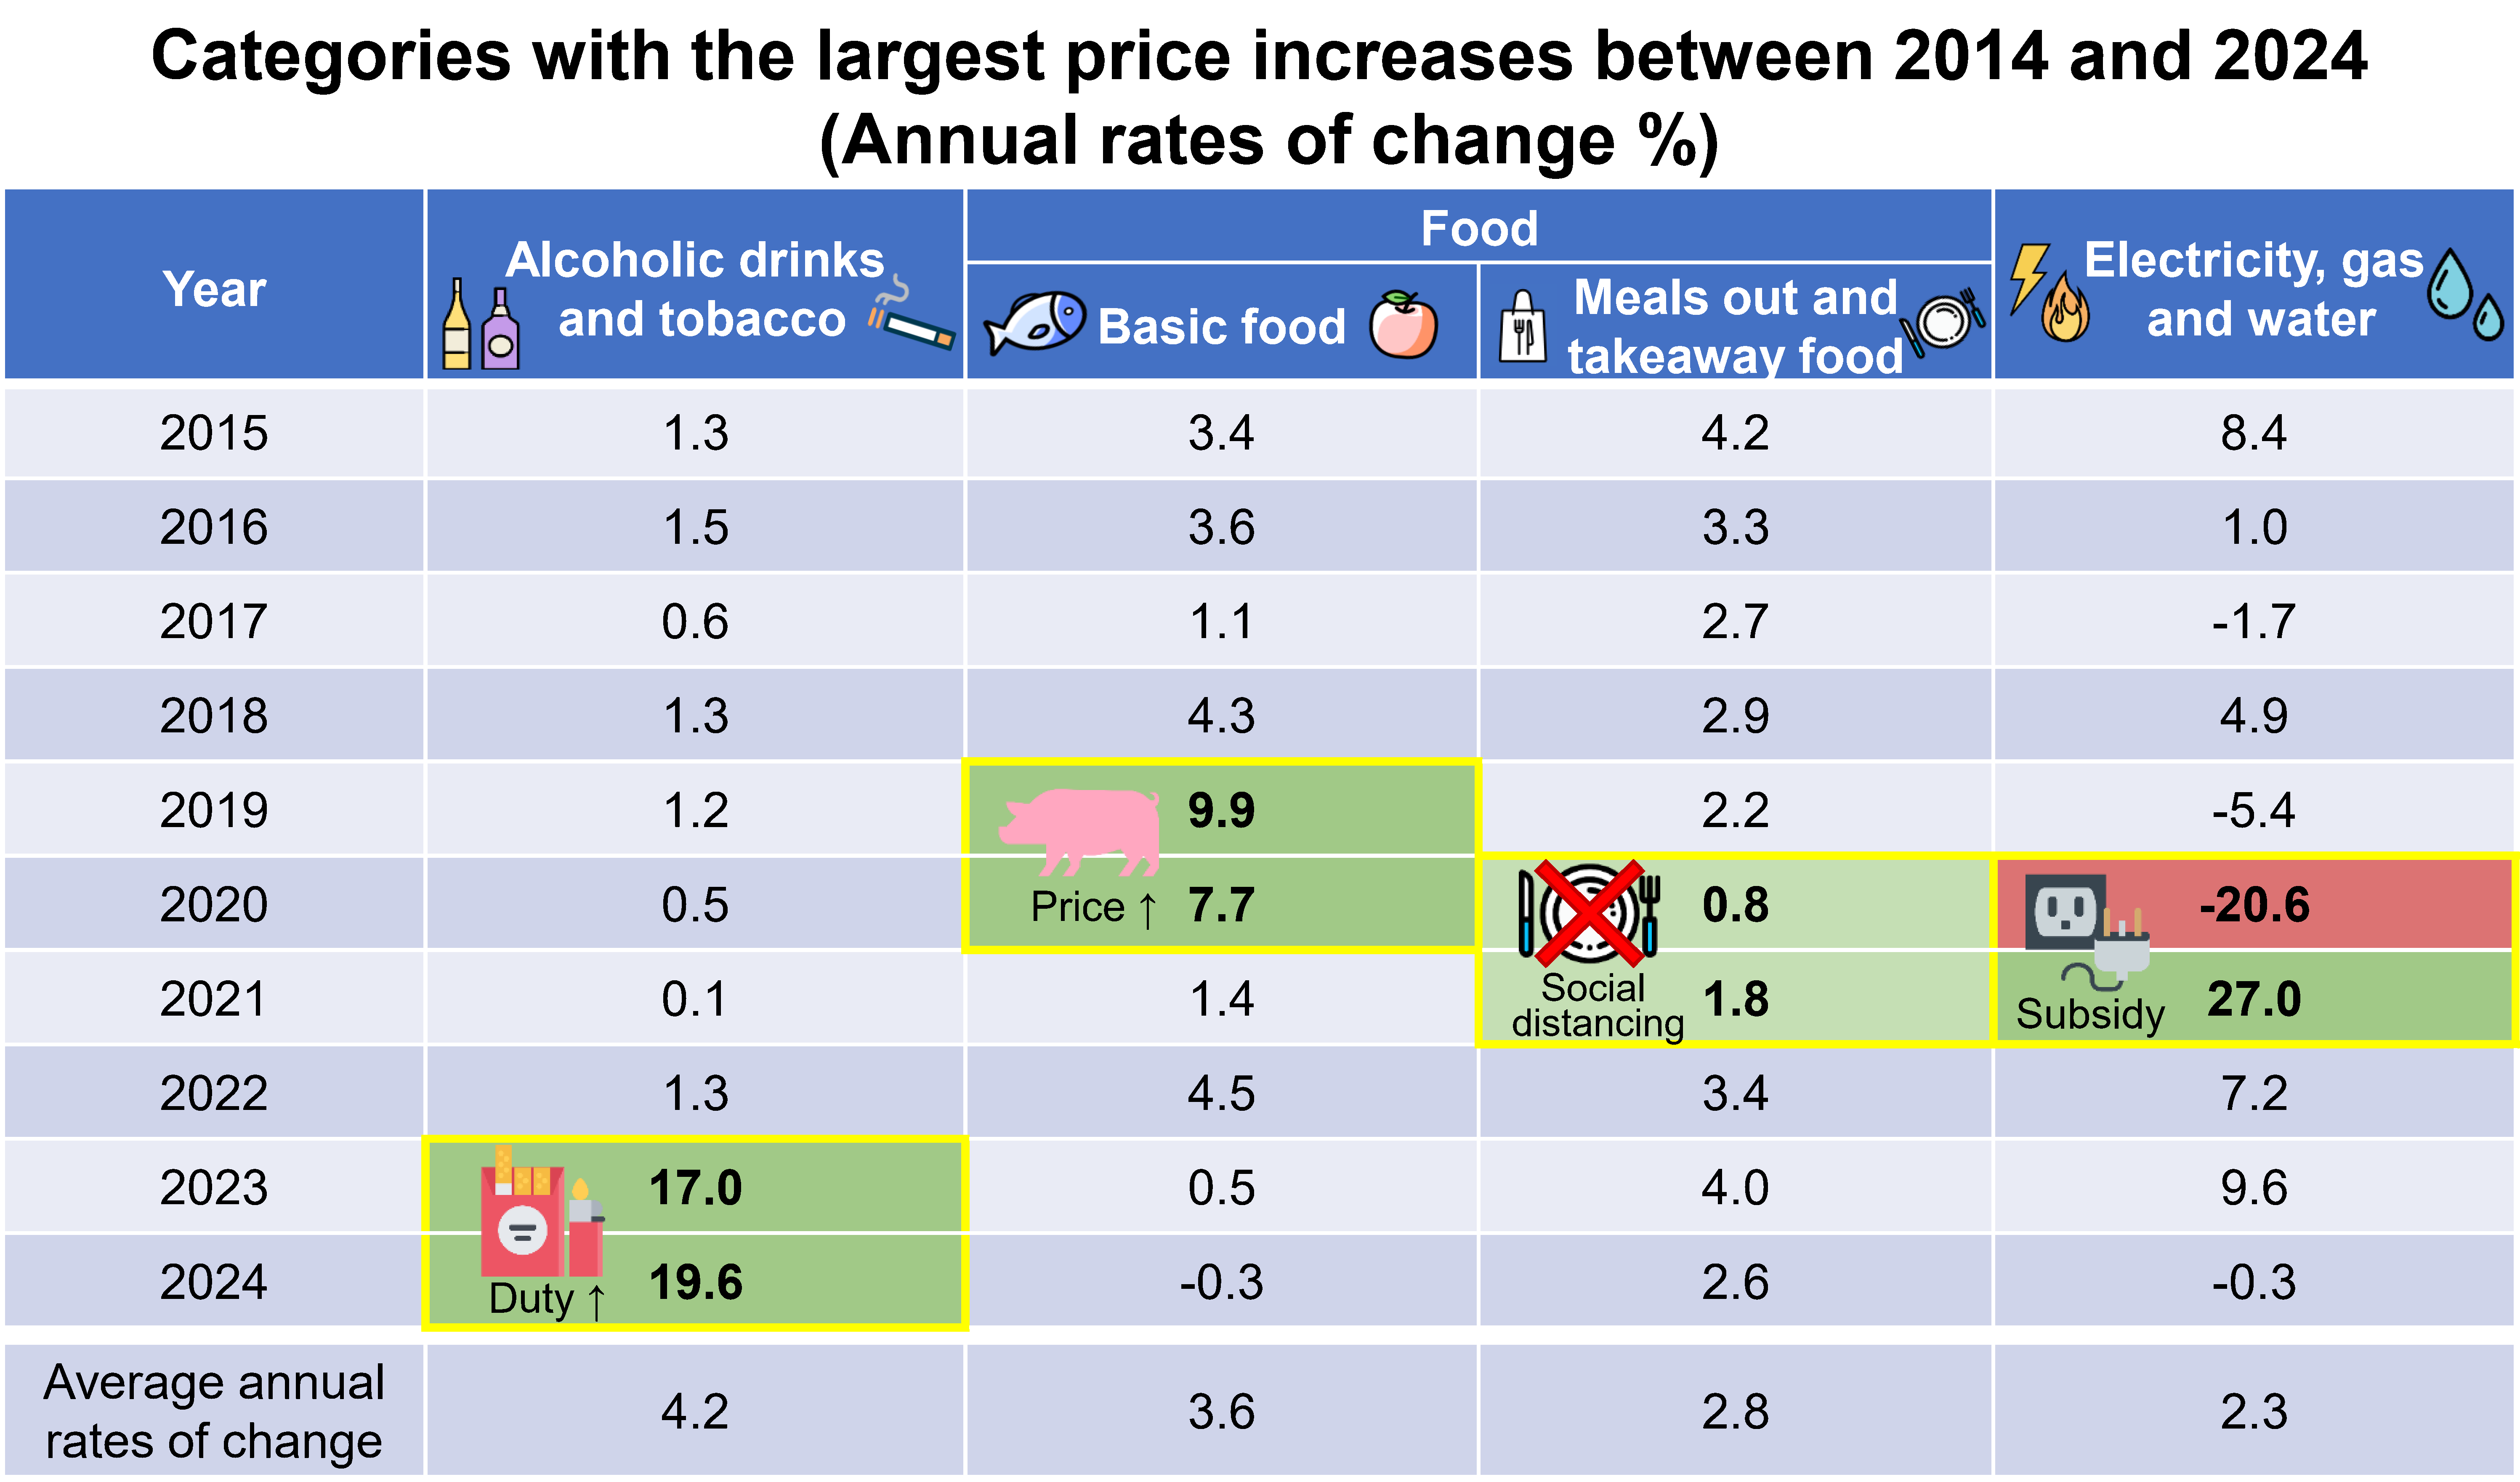
- Among these three categories, the price of "Alcoholic drinks and tobacco" increased the most, with an average annual increase of 4.2%, mainly due to the Government's substantial increases in tobacco duty by 31.5% and 31.9% in 2023 and 2024 respectively.
- Next is "Food", with prices increasing by an average of 3.1% annually. Basic food prices generally showed an upward trend, particularly with significant increases in 2019 and 2020 because of the impact of the epidemic, during which pork prices surged due to supply disruptions. With the return to normalcy after the epidemic, the rates of increase of basic food prices gradually slowed down. Meals out and takeaway food prices rose continuously over the past decade, but the rates of increase moderated in 2020 and 2021 as a result of the social distancing measures implemented during the epidemic.
- Followed by "Electricity, gas and water", with prices rising by an average of 2.3% annually. The price increase was primarily driven by electricity, whose prices rose by an average of 2.6% per year. Between 2014 and 2024, electricity prices have experienced significant fluctuations, such as a 33.4% decrease in 2020 and a 42.1% increase in 2021, mainly attributable to the differences in the amount of electricity charges subsidy provided by the Government. Moreover, the frequent adjustments in fuel charge have also led to the relatively large fluctuations in electricity prices over the past decade.
Have prices increased across all categories of consumer goods and services?
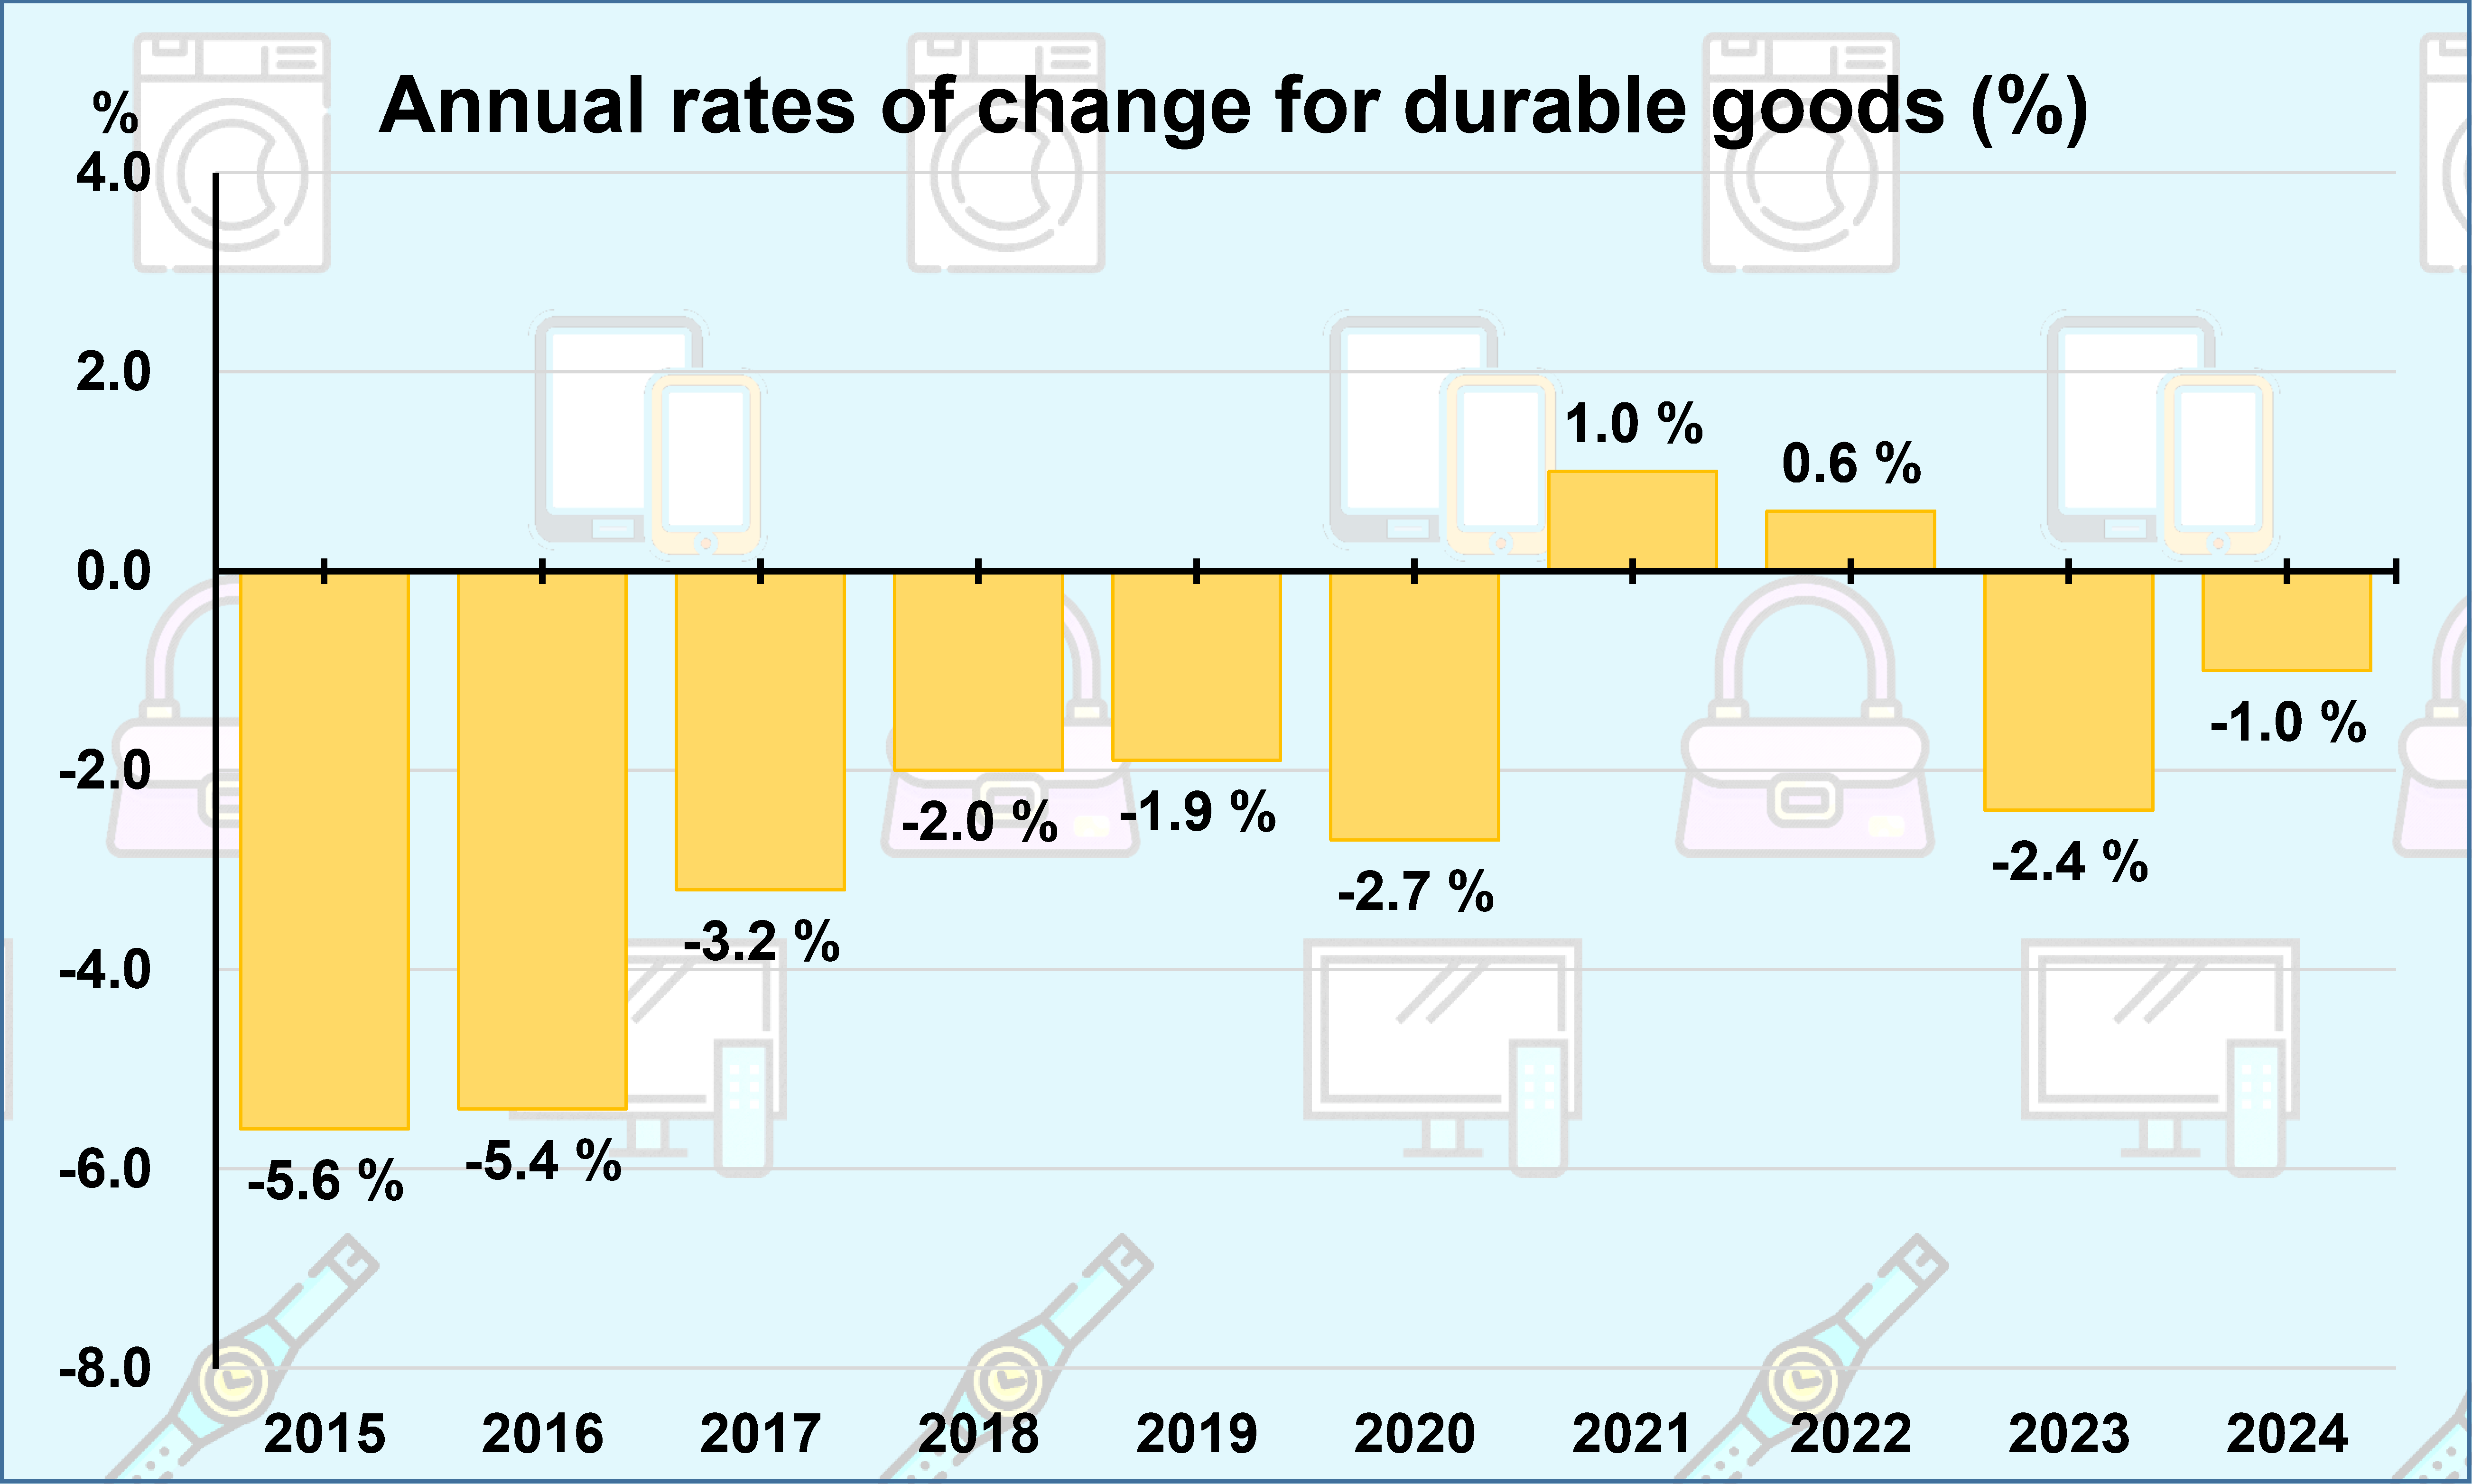
The prices of "Durable goods" have generally been on a downward trend over the past decade, falling by an average of 2.3% annually, partly due to the decline in the prices of information technology and telecommunications equipment, as well as video and sound equipment, amid rapid technological advancement.
As the price changes of different consumer goods and services vary in both direction and magnitude, along with their different shares in household expenditure, their impacts on the overall price change are also different. Referring to the changes in overall prices in the Composite CPI makes it easier to understand the overall inflation situation.
For more information and the latest monthly CPI, please visit the subject webpage on "Consumer Prices".
LAU Po-wa, Iris
Statistician
24 March 2025